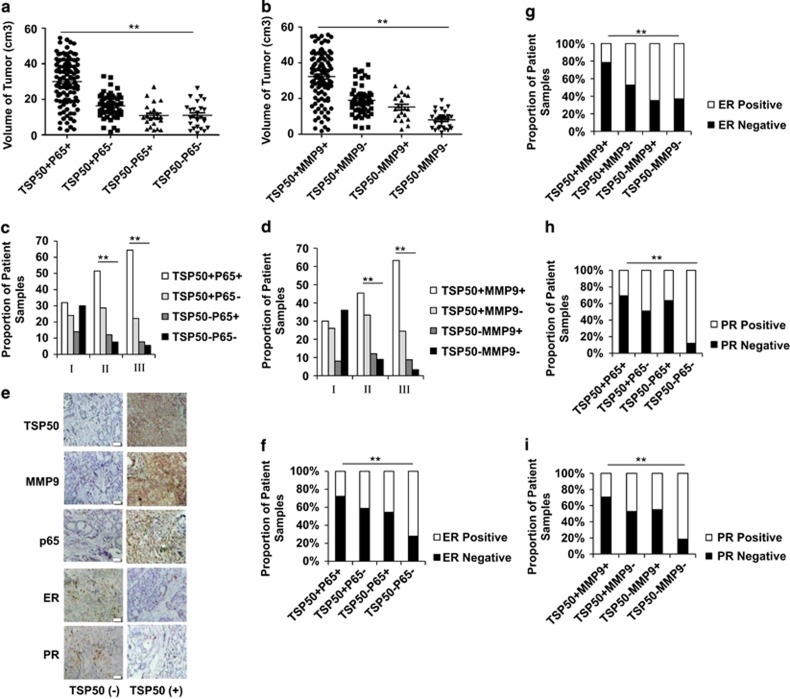
Figure 8.
The correlation of TSP50/p65 and TSP50/MMP9 levels with some clinical and pathological parameters in human breast carcinoma. (a) The correlation between TSP50/p65 level and tumor sizes in the 206 breast cancer samples was analyzed by Fisher's exact test. Each data point represents an individual sample. (b) The correlation between TSP50/MMP9 level and tumor sizes in the 206 breast cancer samples was analyzed by Fisher's exact test. Each data point represents an individual sample. (c) The correlation between TSP50/p65 level and pathologic grade in the 206 breast cancer samples was analyzed by Fisher's exact test. (d) The correlation between TSP50/MMP9 level and pathologic grade in the 206 breast cancer samples was analyzed by Fisher's exact test. (e) Immunohistochemistry of TSP50, p65, MMP9, ER, and PR in the 206 breast cancer samples. (f) The correlation between TSP50/p65 level and ER expression was analyzed by Fisher's exact test. Scale bar, 200 μm. (g) The correlation between TSP50/MMP9 level and ER expression was analyzed by Fisher's exact test. (h) The correlation between TSP50/p65 level and PR expression was analyzed by Fisher's exact test. (i) The correlation between TSP50/MMP9 level and PR expression was analyzed by Fisher's exact test. **P<0.01

