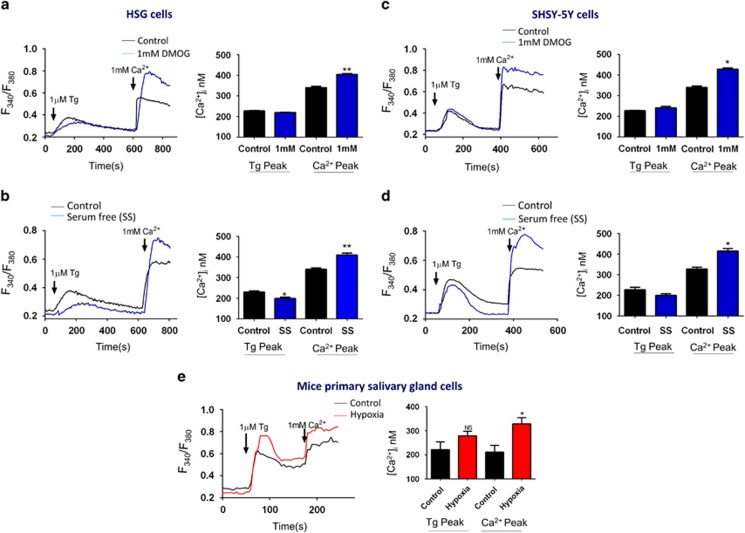
Figure 3.
Increase intracellular calcium in autophagy induces cells. Representative traces showing the transient increase in [Ca2+]i after addition of 1 mM calcium to HSG cells (a) and in SHSY-5Y cells (b) pretreated with 1 mM DMOG. Bar diagram shows the [Ca2+]i in nM concentration of the above-mentioned experiment. Each bar gives the mean±S.E.M. of 50 separate experiments. *P<0.05 and **P<0.01. Representative traces showing the transient increase in [Ca2+]i after the addition of 1 mM calcium to HSG cells (c) and in SHSY-5Y cells (d) pretreated with serum-free media. Bar diagram shows the [Ca2+]i in nM concentration of the above-mentioned experiment. Each bar gives the mean±S.E.M. of 45 separate experiments. *P<0.05 and **P<0.01. (e) Representative traces showing the transient increase in [Ca2+]i after addition of 1 mM calcium in primary salivary gland cells isolated from the hypoxia induce mice model when compared to the control (normoxia) samples. Bar diagram shows the [Ca2+]i in nM concentration of the above-mentioned experiment. Each bar gives the mean±S.E.M. of 20 separate cells. *P<0.05

