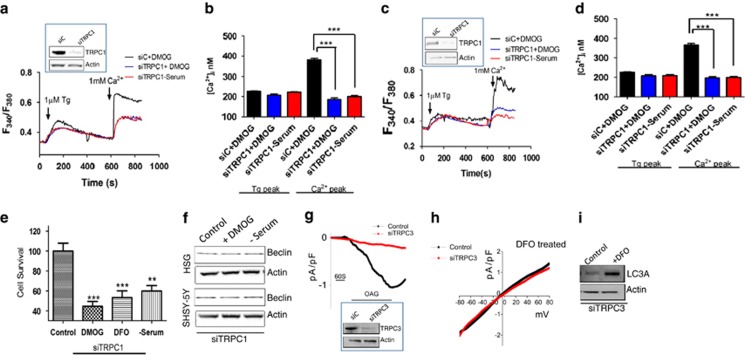
Figure 6.
Knockdown of TRPC1 attenuated the autophagy-induced intracellular calcium increase and also affects the cell viability. Western blot images showing the knockdown of TRPC1 using siRNA, HSG cells (a) (70% knockdown, n=3, P<0.01), and SHSY-5Y cells (b) (72% knockdown, n=3, p<0.001). Representative traces showing the transient increase in [Ca2+]i after the addition of 1 mM calcium to siRNA TRPC1 knockdown HSG cells (a) and in SHSY-5Y cells (b) pretreated with 1 mM DMOG or in serum-free media. Bar diagram (c and d) shows the [Ca2+]i in nM concentration of the above-mentioned experiment. Each bar gives the mean±S.E.M. of 40 separate cells. *P<0.05 and ***P<0.001. (e) Bar diagram showing the cell viability assay (MTT assay) in the TRPC1 knockdown SHSY-5Y cells, pretreated with 1 mM DMOG or 1 mM DFO or in serum-free media. Each bar gives the mean±S.E.M. of four separate experiments. **P<0.01. (f) Western blot images showing the expression of autophagy marker beclin-1 in HSG and SHSY-5Y cells pretreated with 1 mM DMOG or in serum-free media for 24 h. (g) Western blot image showing the TRPC3 knockdown using siRNA in SHSY-5Y cells (60% knockdown, n=3, P<0.01). Application of 50 μM OAG in bath solution induced inward currents at −80 mV in control and TRPC3 knockout cells. (h) Under DFO treatment, respectively I–V curves of currents induced by the application of 1 μM Tg in control and TRPC3 knockout cells treated with 1 mM DFO. The traces are representative of average (8–10 recordings) of current intensity at −80 mV. (i) Western blot images showing the expression of LC3A in siTRPC3 SHSY-5Y cells with and without 24 h pretreatment with 1 mM DFO (n=3, P<0.05)

