Figure 1.
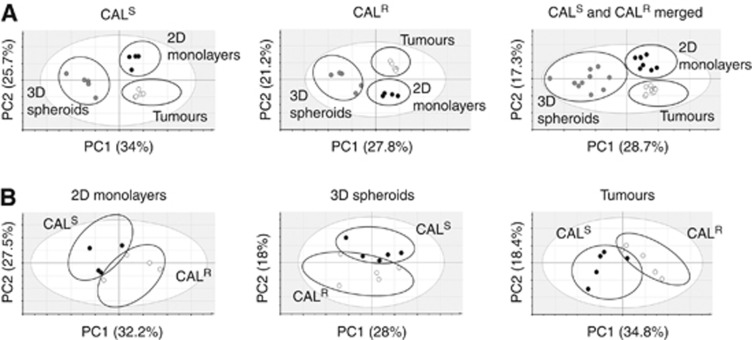
Unbiased metabolomic profiling of CALS and CALR tumour models. (A) 2D PCA score scatter plots showing a separate clustering for 1H NMR data from cells grown as 2D monolayers, 3D spheroids and xenograft tumours within the CALS and CALR cell lines separately and when the data are merged. (B) 2D PCA score scatter plots showing separate clustering for CALS and CALR 1H NMR data points within the 2D cell model, 3D spheroids and tumours. PC1 and PC2 are the two most important principal components explaining the variation in the data (shown as percentages in the x and y axes).

