Figure 5.
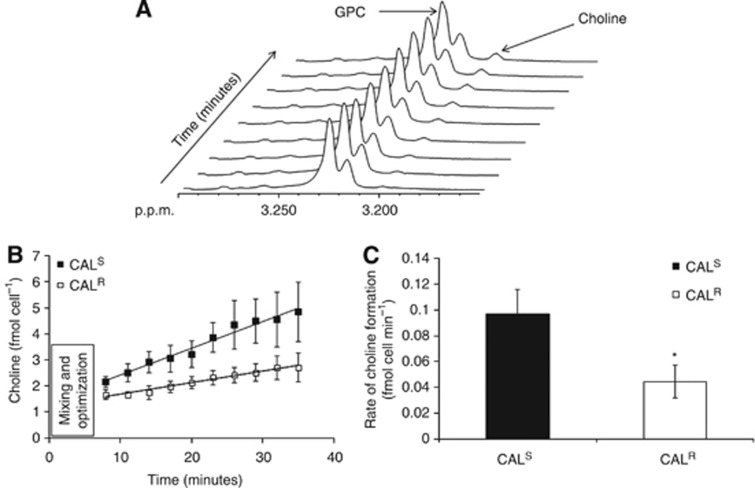
GPC-pd activity assay in CALR and CALS monolayers. (A) Sequential 1H NMR spectra from the GPC-pd assay showing the changes in choline and GPC resonances over time. (B) Build up of choline in 2D CALR and CALS cells over time (total of 35 min) following addition of GPC. (C) Quantification of GPC-pd activity shows a decrease in CALR relative to CALS cells. *P=0.03, n=4.

