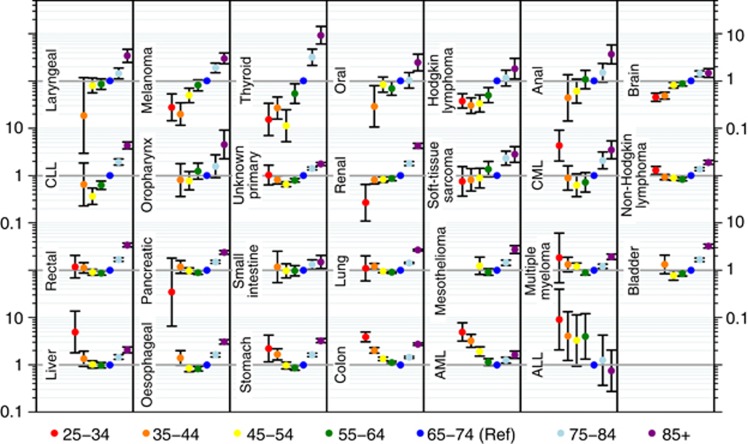
Figure 2.
Cancer-specific odds ratios and 95% confidence intervals for emergency presentation by age group compared with 65–74 years (reference). Note that where cancer-specific age groups contained no cases or all cases were either emergency or non-emergency presentations, odds ratios cannot be estimated and are not shown. This relates to the two younger age groups (25–34 or 35–44), for a total of 30 individual tumours across nine cancers.

