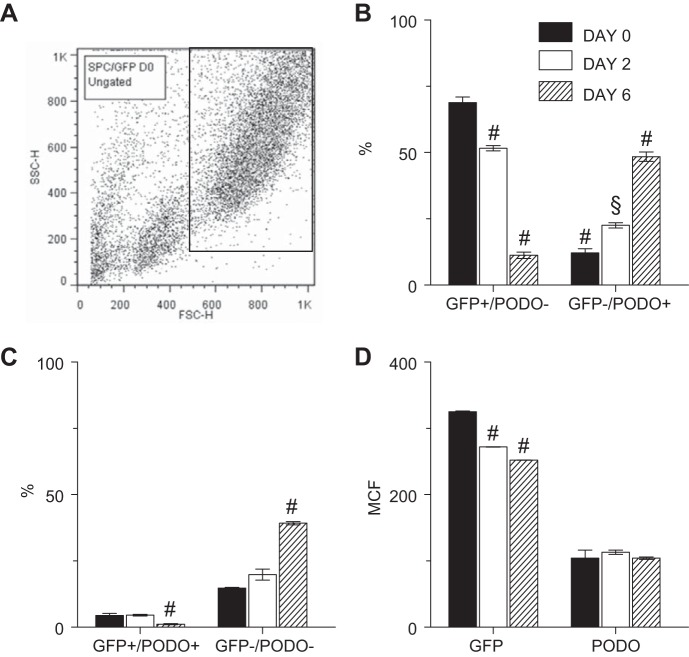
Fig. 6.
Influenza A virus infection led to mutually exclusive changes in expression of SP-C and PODO by individual ATII cells isolated from SP-CGFP mice. A: representative flow cytometric quadrant plot showing the gating strategy for ATII cell flow cytometry studies, based on the forward- and side-scatter characteristics of ATII cells isolated from uninfected SP-CGFP mice. B: effect of infection with influenza A/WSN/33 virus on percentage of ATII cells that express either GFP or PODO, but not both. C: effect of infection with influenza A/WSN/33 virus on percentage of ATII cells that do not express either GFP or PODO and percentage that coexpress both proteins. D: effect of infection with influenza A/WSN/33 virus on ATII cell mean channel fluorescence (MCF) for GFP and PODO; n = 3 uninfected mice, 4 mice at 2 dpi, and 7 mice at 6 dpi. §P < 0.005 and #P < 0.001 vs. uninfected mice for each group. Data are presented as means ± SE.

