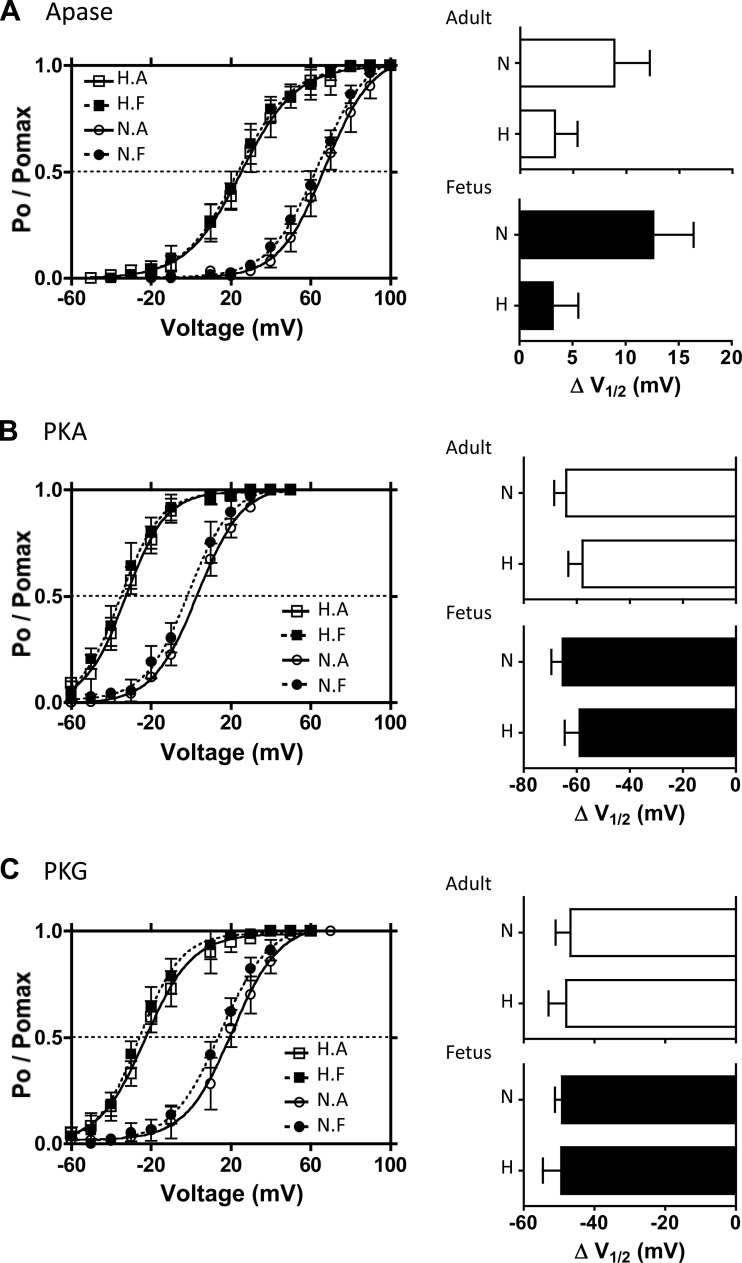
Fig. 3.
Effects of exogenous phosphorylation and dephosphorylation on BK channel activities. Single BK channel recordings of BK channels from inside-out micro patches were obtained in 3 μM free [Ca2+] from the isolated myocytes of the 4 experimental animal groups: LTH (H) and normoxic (N) and adult (A) and fetus (F). A: voltage-activation curves of BK channels with alkaline phosphatase (Apase, 350 U/ml) in the bathing medium. Bar graphs summarize the extent to which Apase treatment right-shifts the activation curves in terms of change in V1/2 values for adult (top) and fetal (bottom) groups. B: voltage activation curves of BK channels in the presence of exogenous PKA. After phosphatase pretreatment, purified PKA catalytic subunit (cPKA, 30 U/ml) was added in the presence of KT5823, OA, and ATP. The extent to which PKA left-shifts V1/2 values is summarized on the bar graphs. C: voltage activation curves of BK channels in the presence of exogenous PKG. Following phosphatase pretreatment, purified PKG (2,000 U/ml) was added in the presence of KT5720, OA, and ATP. Effect of PKG left-shift V1/2 values is summarized on the right bar graphs. Solid lines show the best-fit curves to the Boltzmann equation from which V1/2 values were calculated.

