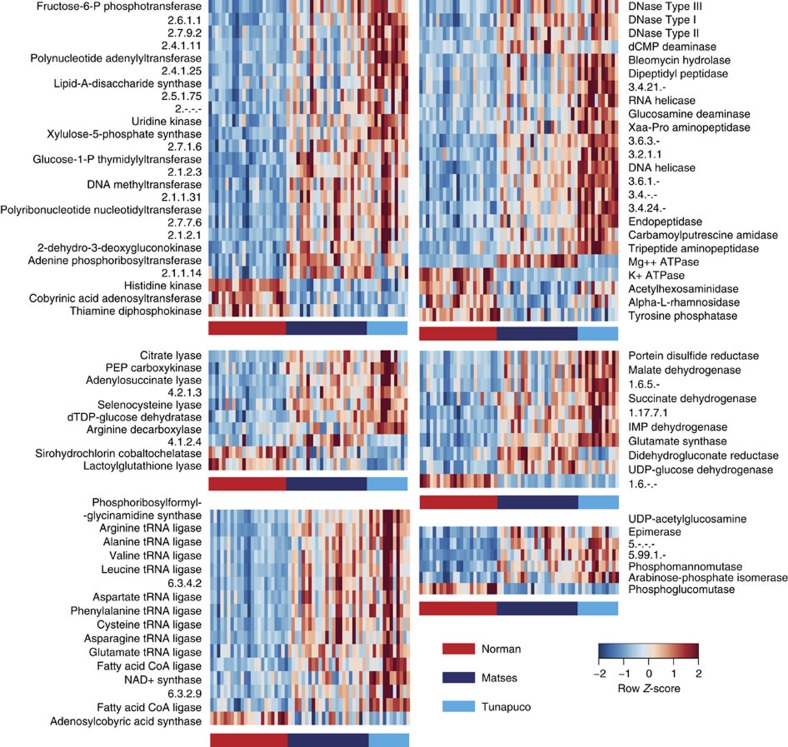
Figure 5. Heatmap of ECs showing significant differences between the gut microbiomes of Matses, Tunapuco and Norman populations.
Enzymes are grouped based on EC class. Comparisons between populations were performed using Kruskal–Wallis tests (FDR-corrected P<0.05). Heatmap is colour coded based on row z-scores.

