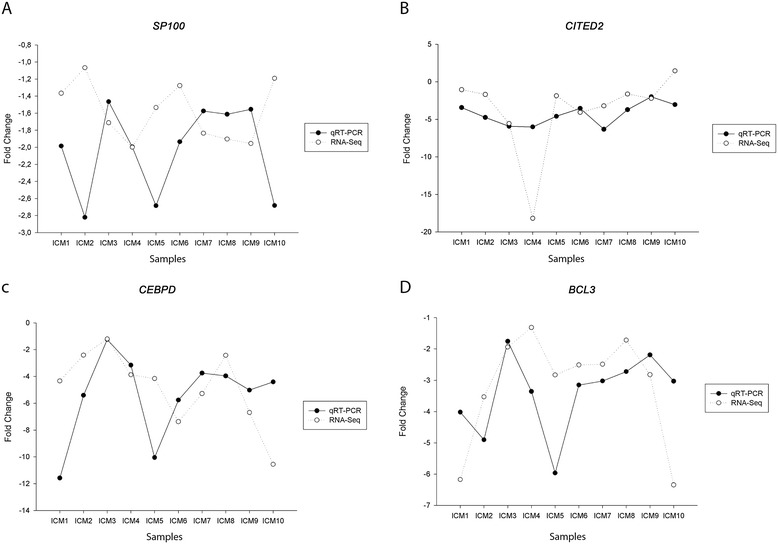
Figure 4.

qRT-PCR vs RNA-Seq data comparison. Individual ICM vs CNT fold change data obtained by qRT-PCR and RNA-Seq (Y-axis) were represented for each patient (X- axis) in SP100 (A), CITED2 (B), CEBPD (C), and BCL3 (D). Slight differences are visualized as the gaps between the points of the two spline curve lines in the scatter-plot.
