
Figure 5.
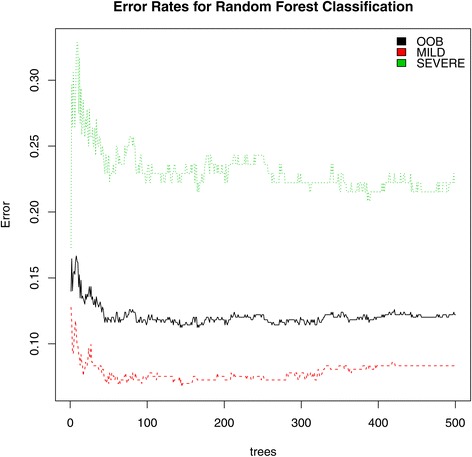
CAESAR error rates. Error rates for CAESAR’s random forest classified are depicted with severe denoted by the green line, mild denoted by the red line and out-of-bag (OOB) error denoted by the black line. CAESAR achieved a sensitivity = 91.67 and specificity = 77.78 indicating that it was able to discriminate between severe and mild phenotypes. CAESAR was able to detect mild phenotypes better than severe phenotypes.