
Figure 1. Micrographs of Aortic Tissue Sections Stained With H&E in Diabetic and Control Rats.
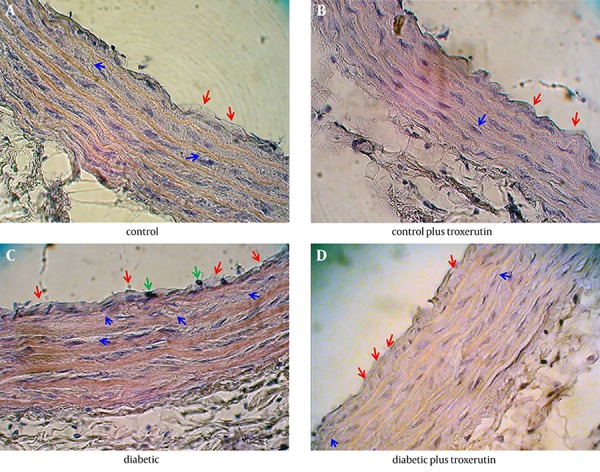
A, control group; B, control plus troxerutin group; C, diabetic group; D, diabetic plus troxerutin group. Red arrow indicates lipid deposition in tunica intimae; blue arrow indicates lipid deposition in tunica media and green arrow indicates macrophage infiltration in tunica intimae.