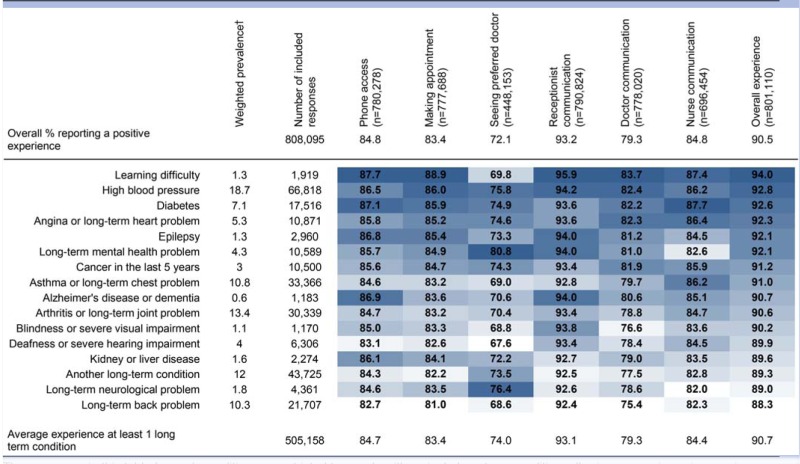
Table 3.
Predicted percentages* of positive patient experience by long-term condition
 |
The responses in this table for each condition are restricted to people with a single long-term condition, allowing comparisons in experience between conditions; as a benchmark, findings from all included responses are given at the top, and all responses from people with long-term conditions at the bottom of the table. Colour code from dark blue (higher predicted percentage of patients with a positive patient experience) to white (lower predicted percentage), by question, and conditions sorted by the percentage endorsing a positive experience to the ‘Overall experience’ question.
*These percentages are predicted from multivariable logistic regression models to give the percentage of responders expected to report a positive experience should they have the same age, gender, ethnicity and socioeconomic composition as all included survey responders (this percentage is also known as recycled predictions); full results from these models available in online supplementary appendix table S1.
†Validation available on request from the study authors, estimation based on all survey responders.
