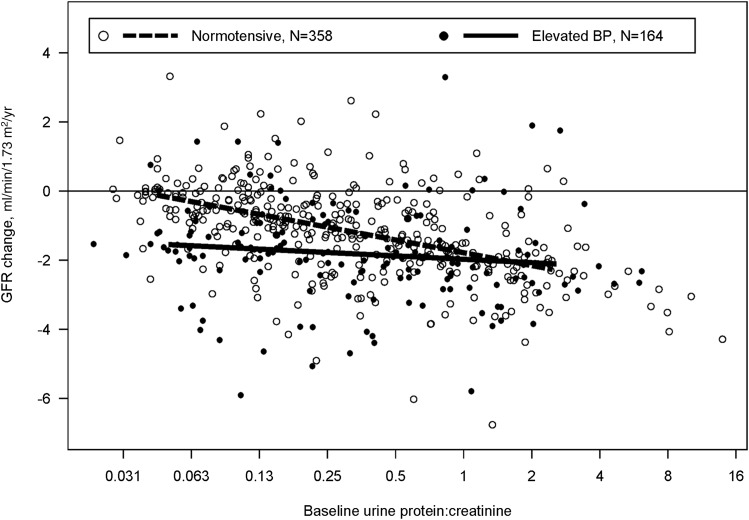
Figure 1.
Changes in GFR (ml/min per 1.73 m2 per year) by baseline urine protein-to-creatinine ratio (Up/c) and casual BP status for 522 children with nonglomerular CKD. Individual empirical Bayes estimates are shown as dots: black for children with elevated BP (>90th percentile for age, sex, and height) and white for children with normotensive BP (≤90th percentile). BP status–specific expected changes derived from linear mixed-effects models of GFR on baseline Up/c are shown as a solid line (elevated BP children) and a dashed line (normotensive BP children).

