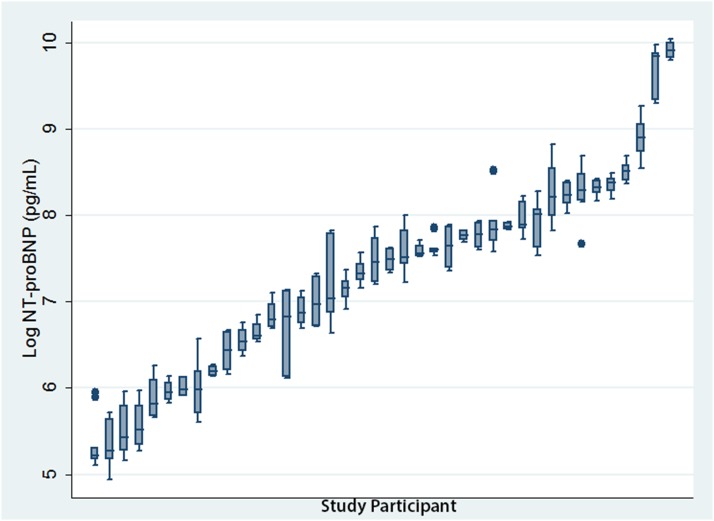
Figure 3.
Box plot of NT-proBNP concentrations for stable participants during the weekly follow-up phase plotted in ascending order of median NT-proBNP concentrations. Each box plot depicts five logarithmically transformed NT-proBNP concentrations taken from a single stable participant over the first 5 weeks of the study. The whiskers delimit the range and the middle, lower, and upper lines of the box represent the median, upper, and lower quartiles respectively. Between-person variation is reflected in the variation between median NT-proBNP concentrations across the entire cohort and was large. By comparison, within-person variation depicted by the box plots was much smaller and largely uniform between patients.

