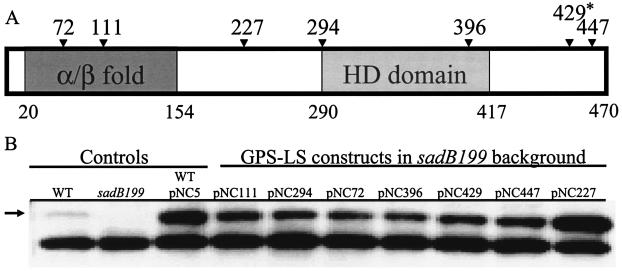
FIG. 6.
Structure-function analysis of SadB. (A) Diagram of SadB. Numbers below the diagram represent residues that define the borders of the putative domains. The α/β fold extends from residue 20 to 154, and the HD domain extends from residue 290 to 417. Numbers above the diagram represent residues at which 5-amino-acid insertions occurred. The asterisk denotes a GPS-LS mutation that resulted in a truncated protein. The figure is not to scale. (B) Stability of proteins resulting from GPS-LS mutagenesis. Protein from whole-cell lysates (5 μg) was resolved by SDS-PAGE and analyzed by Western analysis with a SadB peptide antibody. The arrow denotes the SadB cross-reacting band. All GPS-LS constructs were named pNC followed by a numerical designation that represents the residue of insertion or truncation. Plasmid pNC5 (sadB+) was the target for GPS-LS mutagenesis. WT, wild type.

