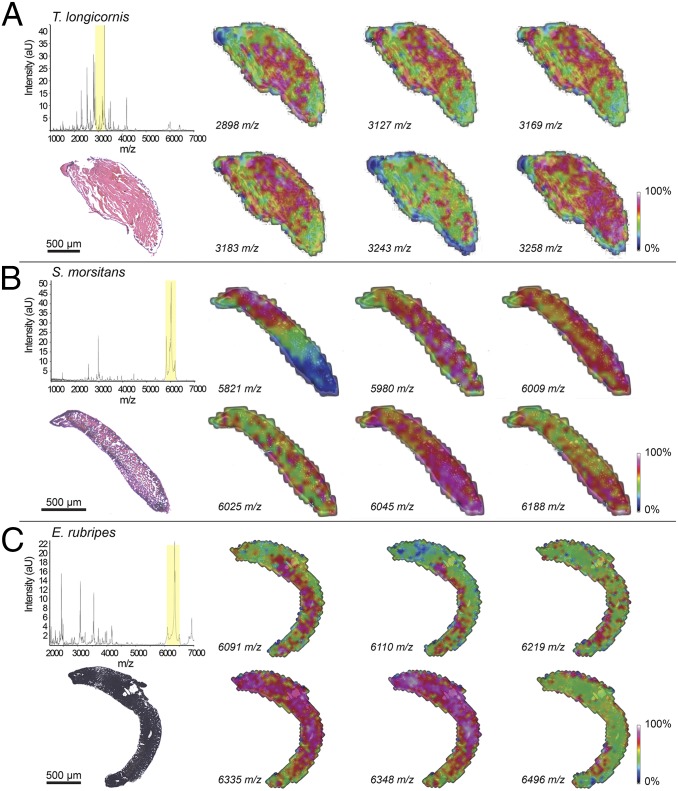
Fig. 4.
MALDI imaging of transverse sections of centipede venom glands. MALDI imaging of venom glands from (A) T. longicornis, (B) S. morsitans, and (C) E. rubripes oriented with top left pointing toward the claw of the forcipule. Normalized spectra averaged across all MS experiments for each section are shown in the left-most panels, above histological images of the sections that were used for MALDI imaging experiments (stained with H&E stain postimaging). The section displayed for E. rubripes was not stained and therefore appears black. Intensities of extracted ions (±1 m/z) from normalized spectra corresponding to peaks within an ∼400 m/z range (indicated by yellow shading in the spectra) are shown as heat-maps across each section.

