Fig. 3.
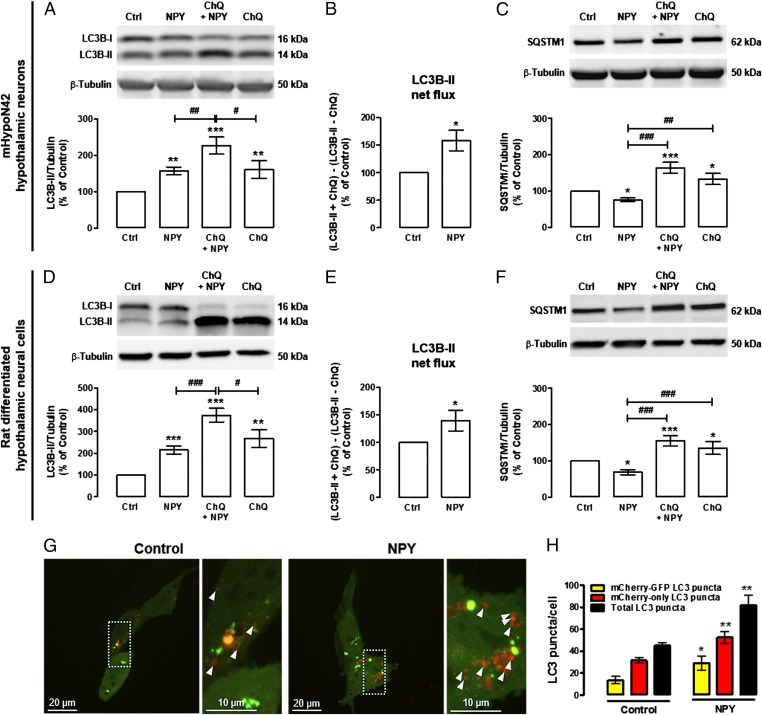
NPY increases autophagic flux in mHypoN42 hypothalamic neurons and in rat differentiated hypothalamic neural cells. mHypoN42 hypothalamic neurons and rat differentiated hypothalamic neural cells were exposed to NPY (100 nM) for 30 min or 6 h, respectively, in the absence or presence of ChQ (100 μM). (A–F) Western blotting analysis of LC3B and SQSTM1. n ≥ 4. *P < 0.05, **P < 0.01, ***P < 0.001, significantly different from control; #P < 0.05, ##P < 0.01, ###P < 0.001, significantly different from NPY. LC3B-II net flux (B and E) was determined by subtracting the densitometric value of LC3B-II amount in samples nontreated with chloroquine (LC3B-II – ChQ) from the corresponding sample treated with ChQ (LC3B-II + ChQ). *P < 0.05, significantly different from control. (G) Representative images of autophagosome (yellow puncta) and autolysosome (red puncta; arrowheads) formation in mHypoN42 hypothalamic neurons transfected with mCherry-GFP-LC3 plasmids. Right images are a higher magnification from the boxed areas in Left. (H) Quantification of the number of mCherry-GFP-LC3 (yellow) and mCherry-only LC3 (red-only) puncta per cell in each condition (>30 cells per group). *P < 0.05, **P < 0.01, significantly different from control.

