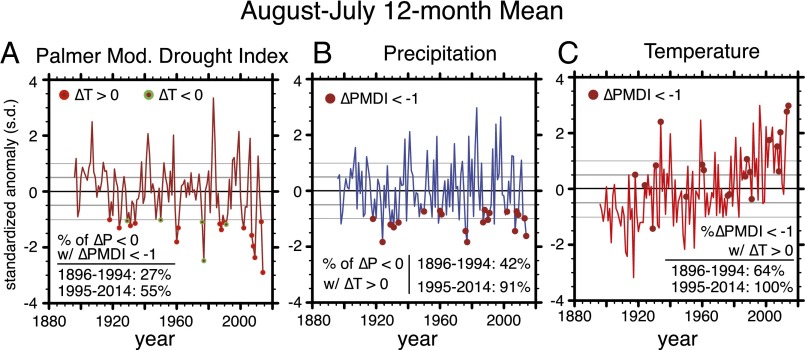
Fig. 1.
Historical time series of drought (A), precipitation (B), and temperature (C) in California. Values are calculated for the August–July 12-mo mean in each year of the observed record, beginning in August 1895. In each year, the standardized anomaly is expressed as the magnitude of the anomaly from the long-term annual mean, divided by the SD of the detrended historical annual anomaly time series. The PMDI is used as the primary drought indicator, although the other Palmer indicators exhibit similar historical time series (Figs. S1 and S2). Circles show the years in which the PMDI exhibited a negative anomaly exceeding –1.0 SDs, which are referred to as 1-SD drought years in the text.

