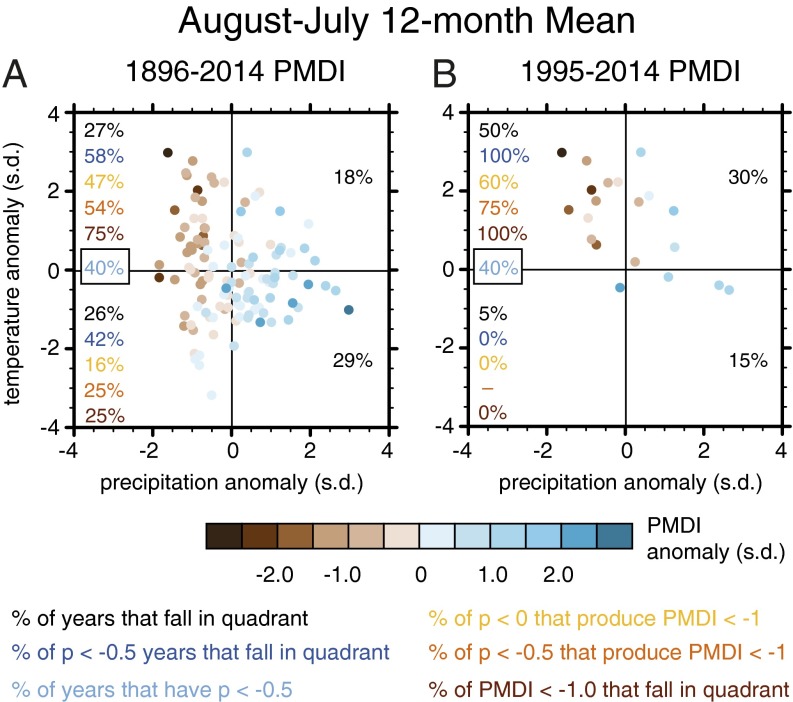
Fig. 2.
Historical occurrence of drought, precipitation, and temperature in California. Standardized anomalies are shown for each August–July 12-mo period in the historical record (calculated as in Fig. 1). Anomalies are shown for the full historical record (A) and for the most recent two decades (B). Percentage values show the percentage of years meeting different precipitation and drought criteria that fall in each quadrant of the temperature–precipitation space. The respective criteria are identified by different colors of text.

