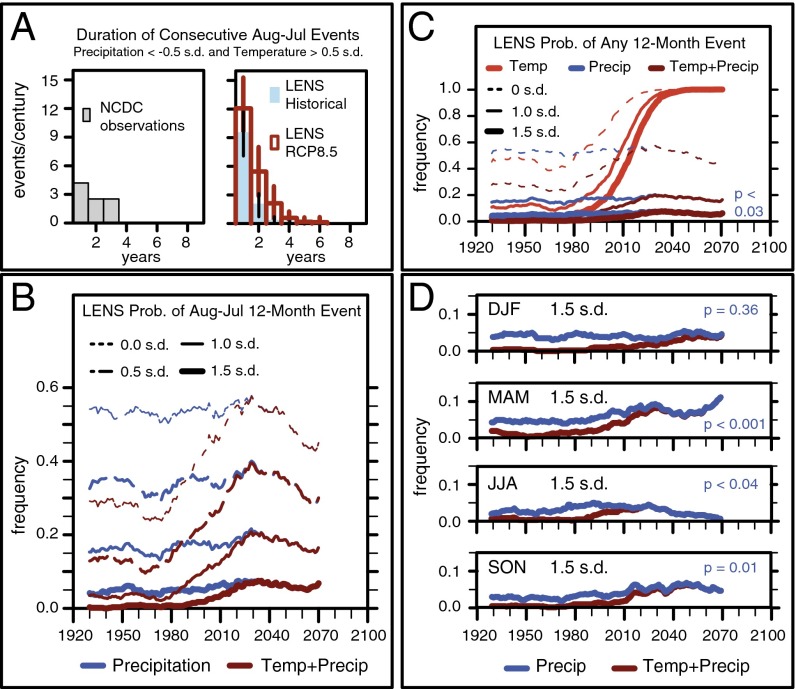
Fig. 4.
Projected changes in the probability of co-occurring warm–dry conditions in the 21st century. (A) Histogram of the frequency of occurrence of consecutive August–July 12-mo periods in which the 12-mo precipitation anomaly is less than –0.5 SDs and the 12-mo temperature anomaly is at least 0.5 SDs, in historical observations and the LENS large ensemble experiment. (B) The probability that a negative 12-mo precipitation anomaly and a positive 12-mo temperature anomaly equal to or exceeding a given magnitude occur in the same August–July 12-mo period, for varying severity of anomalies. (C) The probability that a negative precipitation anomaly and a positive temperature anomaly equal to or exceeding a given magnitude occur in the same 12-mo period, for all possible 12-mo periods (using a 12-mo running mean; see Materials and Methods), for varying severity of anomalies. (D) The unconditional probability of a –1.5 SD seasonal precipitation anomaly (blue curve) and the conditional probability that a –1.5 SD seasonal precipitation anomaly occurs in conjunction with a 1.5 SD seasonal temperature anomaly (red curve), for each of the four 3-mo seasons. Time series show the 20-y running mean of each annual time series. P values are shown for the difference in occurrence of –1.5 SD precipitation anomalies between the Historical period (1920–2005) and the RCP8.5 period (2006–2080).

