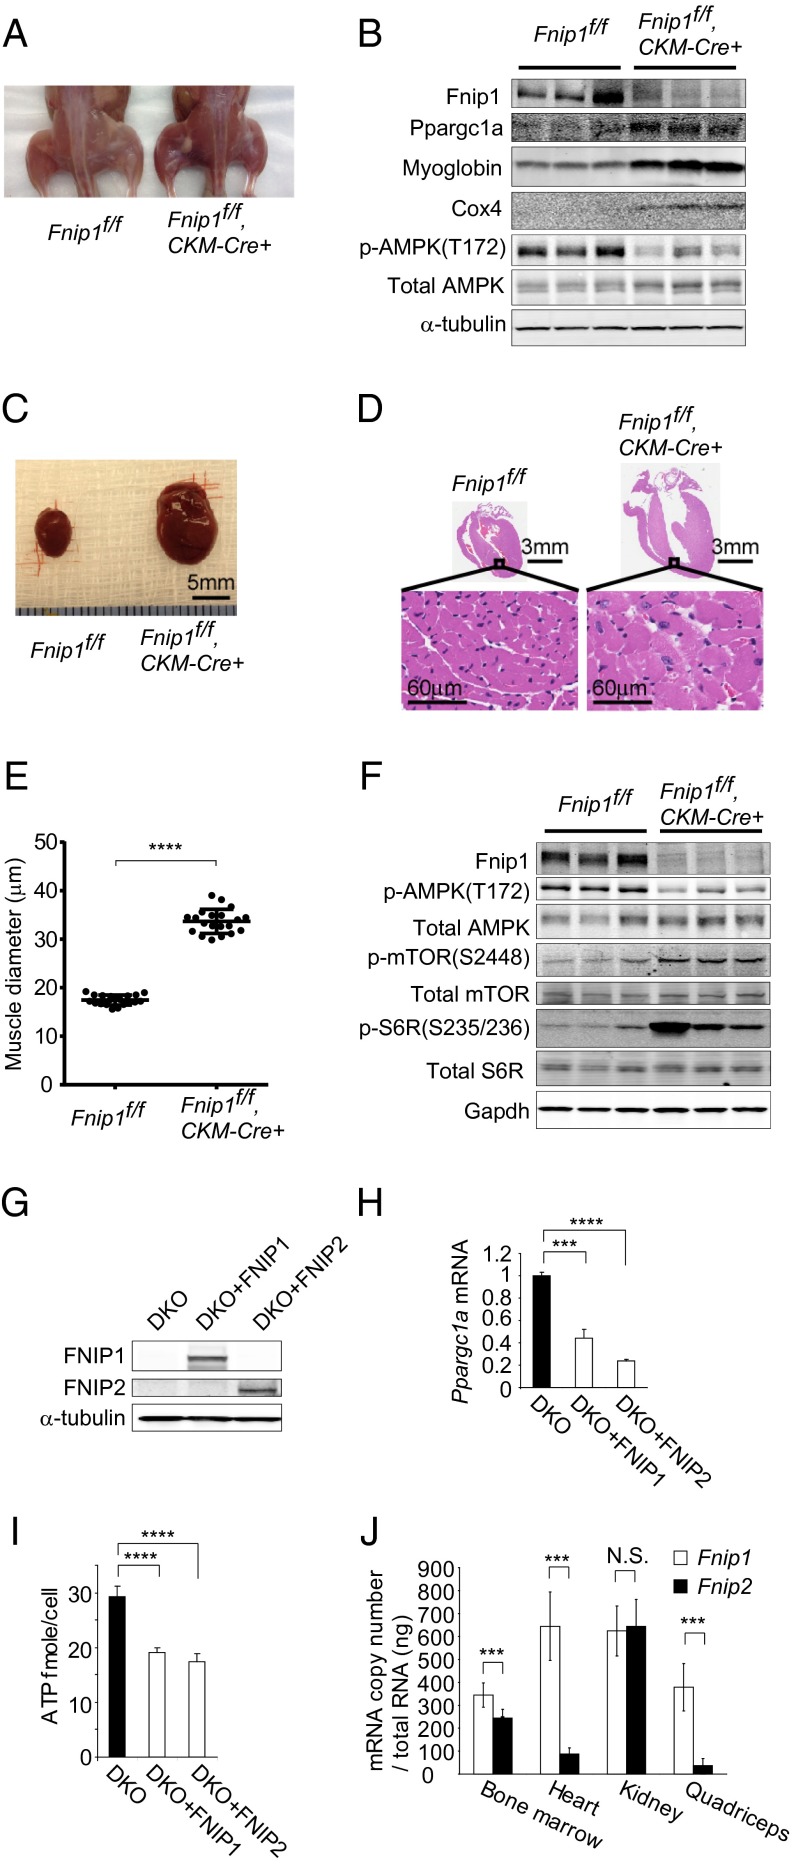
Fig. 2.
Fnip1 and Fnip2 expression differs from organ to organ. (A) Muscle-targeted Fnip1 knockout mice show red-colored muscle relative to control muscle (6 wk of age). (B) Western blotting shows increased mitochondrial biogenesis and decreased pAMPK in Fnip1-deficient muscle. α-tubulin served as a loading control. n = 3 each at 6 wk of age. (C) Fnip1-deficient heart is enlarged relative to control heart (8 wk of age). (Scale bar: 5 mm.) (D) Histology of Fnip1-deficient heart shows enlarged cardiac fibers (8 wk of age). (Scale bars: 3 mm and 60 μm.) (E) Muscle diameter of Fnip1-deficient hearts was increased. n = 20 each at 8 wk of age. P < 0.0001, Student t test. (F) Western blotting of Fnip1-deficient hearts showed decreased pAMPK and activated mTORC1 signaling molecules. Gapdh served as a loading control. n = 3 each at 6 wk of age. (G) Western blotting shows the restoration of either FNIP1 or FNIP2 in Fnip1/Fnip2 null MEFs (DKO). α-tubulin served as a loading control. (H) Restoration of either FNIP1 or FNIP2 suppressed Ppargc1a expression in Fnip1/Fnip2 null MEFs (DKO). n = 3 each. Mean ± SD. P < 0.001 for DKO+FNIP1, P < 0.0001 for DKO+FNIP2; Student t test. (I) Restoration of either FNIP1 or FNIP2 suppressed ATP levels in Fnip1/Fnip2 null MEFs (DKO). n = 6 each. Mean ± SD. P < 0.0001. Student t test. (J) ddPCR showed Fnip1 expression was significantly higher than Fnip2 expression in bone marrow, heart, and quadriceps of C57BL/6 mice but was not significantly higher than Fnip2 expression in kidney of C57BL/6 mice. n = 6 each at 6 wk of age. Mean ± SD. P < 0.001 for bone marrow, heart, quadriceps. N.S., not significant. Student t test.

