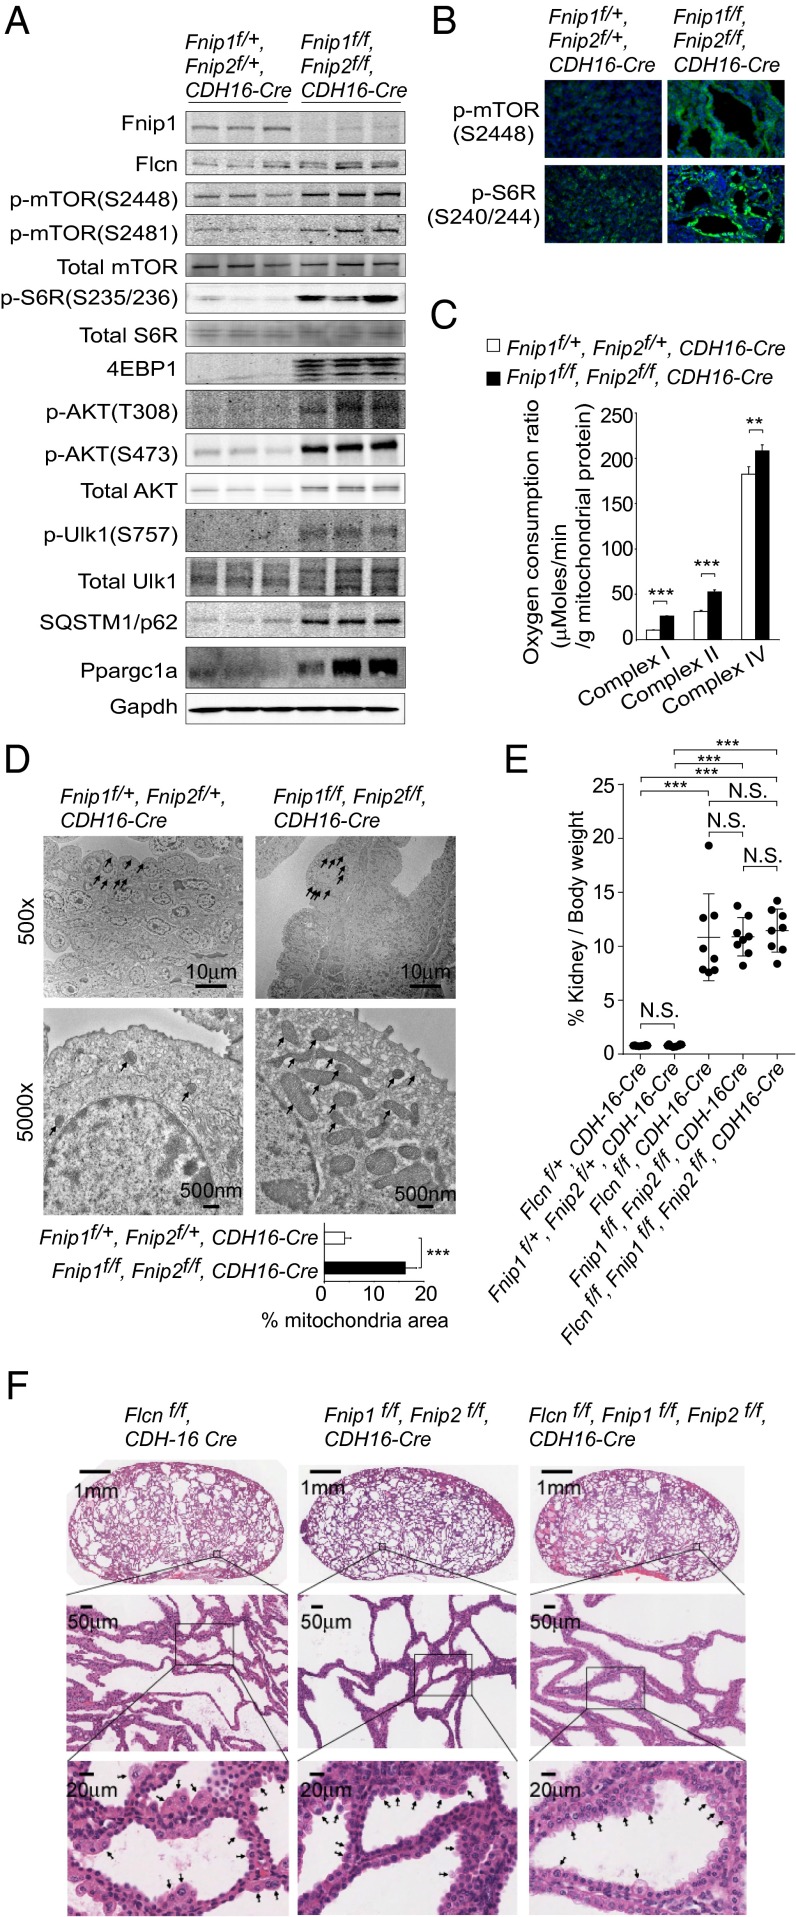
Fig. 4.
Fnip1/Fnip2 double-deficient kidneys are identical to Flcn-deficient kidneys. (A) Western blotting shows increased Ppargc1 and phospho-proteins of the AKT-mTOR pathway in Fnip1/Fnip2 double-deficient kidney. Increased phospho-Ulk1 at Ser757, one of the readouts of mTORC1 activity, correlates with the accumulated SQSTM1/p62, normally degraded by autophagy. Mouse Fnip2 protein is not shown because of technical difficulty developing a unique Fnip2 antibody that does not cross-react with mouse Fnip1. Gapdh served as a loading control. n = 3 at 3 wk of age. (B) Immunofluorescence shows increased staining of p-mTOR (S2448) and pS6R (S240/244) in Fnip1/Fnip2 double-deficient kidney relative to control kidney. Nuclei were stained with DAPI (Blue). Representative of three mice at 3 wk of age. (C) Respiratory capacity of isolated mitochondria is increased in Fnip1/Fnip2 double-deficient kidney relative to control kidney. State 3 respiration of complex I and complex II, and complex IV-dependent respiration, were measured by Seahorse XF96 analyzer. Mean ± SD. n = 4 at 3 wk of age. Student t test (two-sided). (D) Electron microscope images show increased mitochondrial mass in Fnip1/Fnip2 double-deficient kidney compared with control kidney. Arrows indicate mitochondria. (Scale bars: 10 μm and 500 nm.) Percentage of mitochondrial area per cell was quantified for the indicated genotypes. Thirteen cells were evaluated for each genotype. Mean ± SD. Student t test (two-sided). Three weeks of age. (E) The kidney/body weight ratios of 3-wk-old mice with Flcn-deficient, Fnip1/Fnip2 double-deficient, and Flcn/Fnip1/Fnip2 triple-deficient kidneys show no significant differences. Mean ± SD, n = 8 each. Student t test (two-sided). (F) The histologies of kidneys from 3-wk-old Flcn-deficient, Fnip1/Fnip2 double-deficient, and Flcn/Fnip1/Fnip2 triple-deficient mice show no differences. Arrows indicate hyperplastic cells protruding into the cyst lumens that were observed in all of the genotypes. (Scale bars: 1 mm, 50 μm, and 20 μm.)

