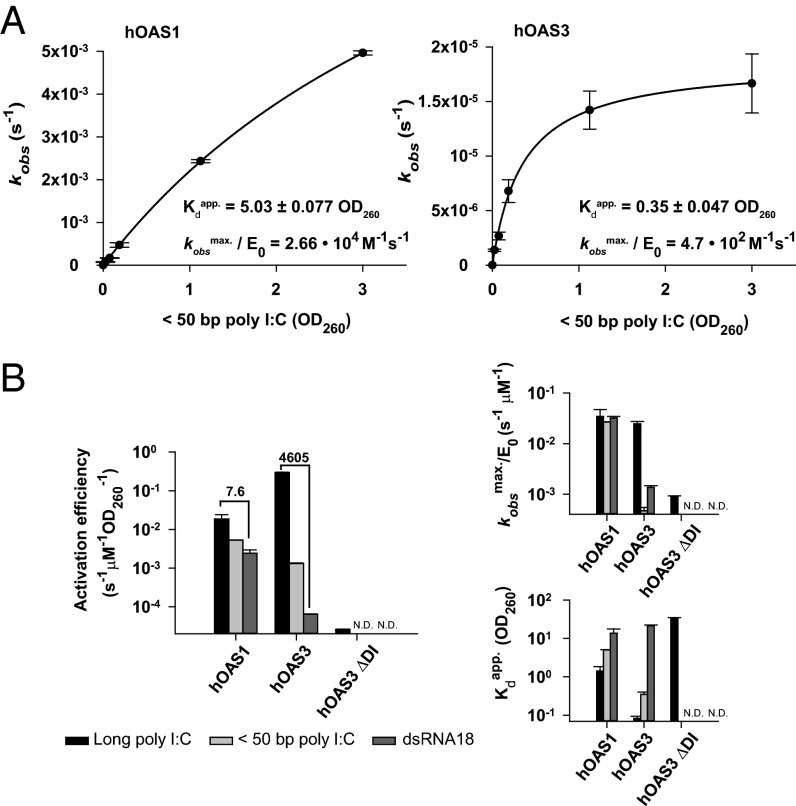
Fig. 5.
Differential sensing of long and short dsRNA by hOAS1 and hOAS3. (A) Activation of 2-5A synthesis by hOAS1 (0.5 μM; Left) and hOAS3 (40 nM; Right) in response to size-fractionated poly I:C with less than 50 base pairs. (B) Comparison of the activation parameters of hOAS1 and hOAS3 with dsRNA of different length. Activation efficiency (Left) is defined as the ratio of specific activity (kobsmax/E0) to the binding affinity (Kdapp), plotted individually on the smaller graphs (right). N.D., not determined. Brackets indicate the fold-difference between reactions with poly I:C and dsRNA18. Data represent mean ± SD determined from at least two independent time courses. E0 is the total concentration of enzyme used.

