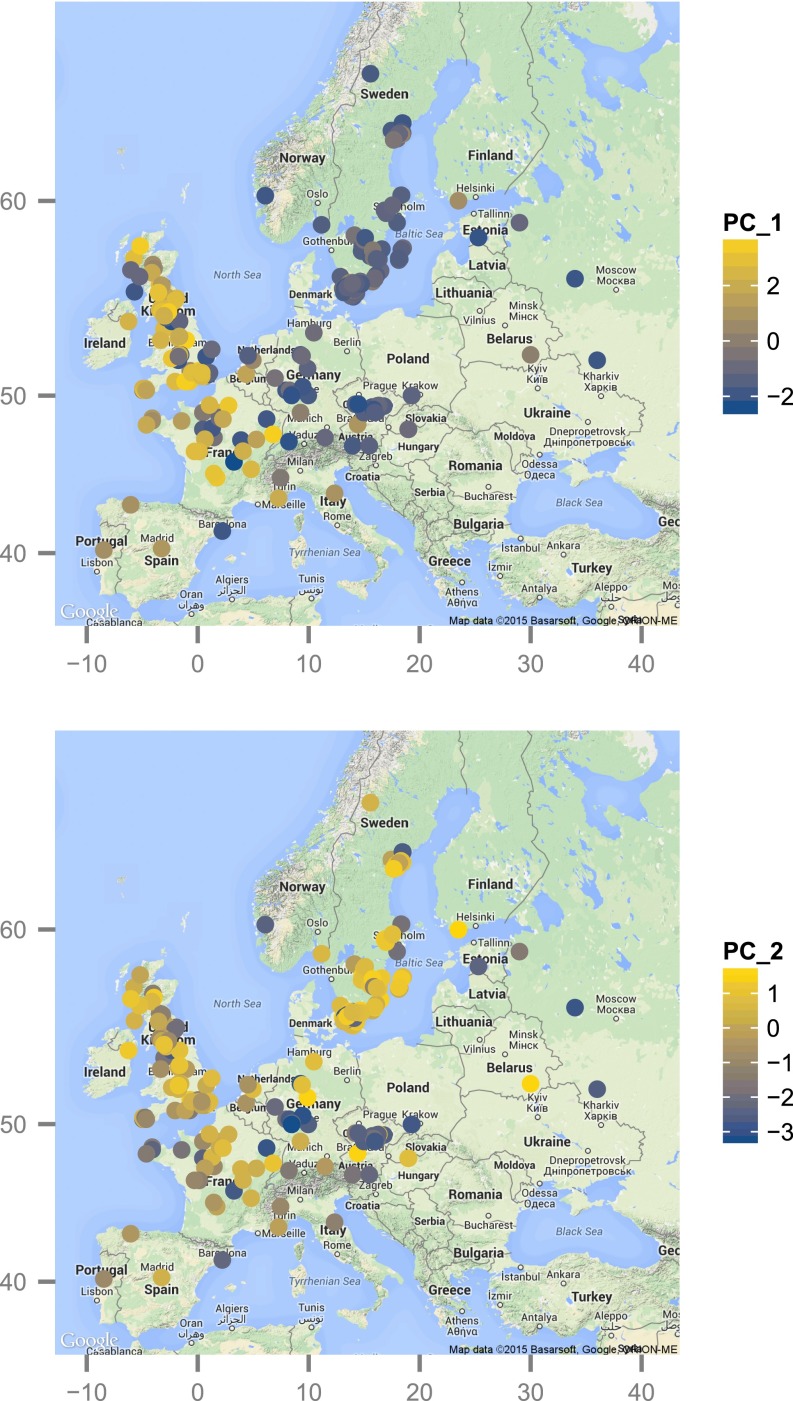
Fig. 1.
Map of methionine-derived GSL variation in Europe. The x and y axes correspond to longitude and latitude, respectively. Dots indicate collection sites, and the color reflects the score of each accession along the first (top map) and second (bottom map) principal component describing GSL profile variation. The gradient from blue to yellow represents an increase in alkenyl and hydroxyalkenyl GSLs (Fig. S2).

