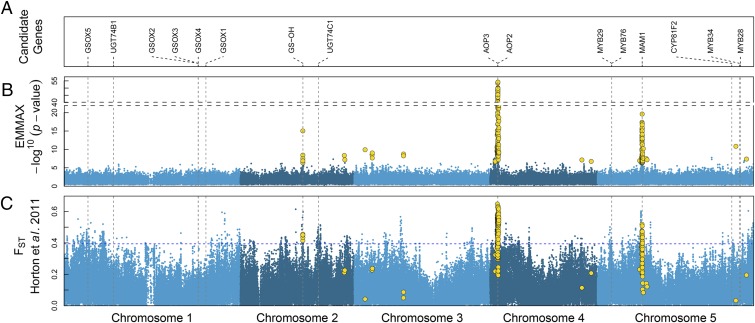
Fig. 2.
Confirmed glucosinolate genes, GWA mapping, and scan. (A) Positions of confirmed genes from the methionine-derived GSL biosynthesis pathway along the five chromosomes of A. thaliana. (B) Manhattan plot of mapping results using EMMAX pooled from all 22 molecules analyzed. SNPs with significant association scores are marked in gold. (C) Wright’s fixation index scan along the Arabidopsis genome, based on 1,080 European accessions, divided into nine populations (15). The blue dotted line represents the 99.5% quantile of the distribution. SNPs significantly associated with GSL variation are marked in gold.

