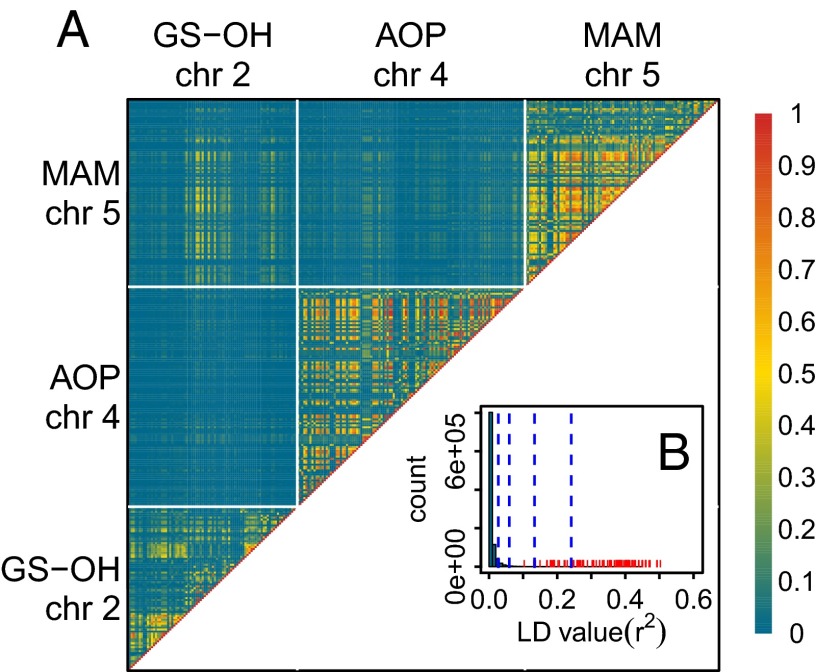
Fig. 3.
LD among SNPs located within 20 kb of the three regions associated with GSL variation, MAM, AOP, and GS-OH. (A) Heat map of LD between pairs of SNPs located near the loci associated with GSL variation. GS-OH, AOP, and MAM are located on chromosomes 2, 4, and 5, respectively. Note the high values of LD between SNPs from chromosomes 2 and 5 at the upper left of the heat map. (B) LD between the associated SNPs in the GS-OH (chromosome 2) and MAM (chromosome 5) regions (in red) compared with a null distribution of for 1,000,000 random pairs of SNPs located on different chromosomes (in blue). The vertical dashed lines mark the 0.95, 0.99, 0.999, and 0.9999 quantiles of the null distribution.

