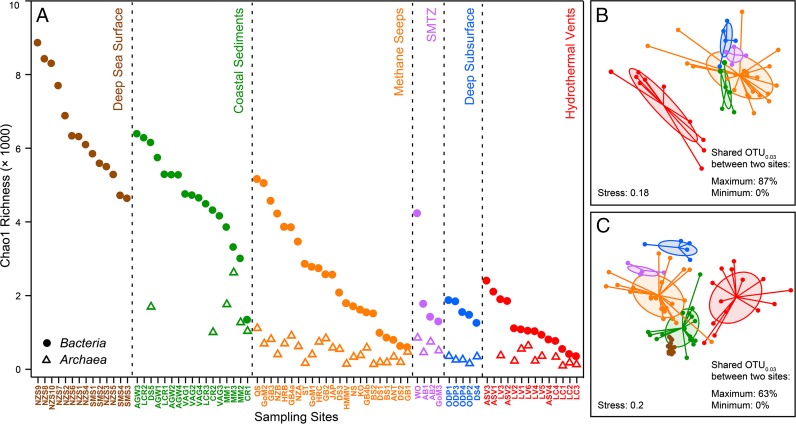
Fig. 2.
Richness estimates and NMDS ordinations based on archaeal and bacterial OTU0.03. (A) The symbols represent the mean of 100 Chao1 richness calculations for each of the 77 investigated sampling sites, with each calculation based on rarefaction of 3,000 randomly chosen sequences without replacement. No archaeal data were available for deep-sea surface sediments. (B and C) Similarity of archaeal (B, 48 samples) and bacterial (C, 77 samples) communities visualized by nonmetric multidimensional scaling (NMDS). Each sample (dot) is connected to the weighted averaged mean of the within group distances. Ellipses represent one SD of the weighted averaged mean. All groups were significantly different as tested with a subsampling-based Redundancy Analysis approach (see also SI Appendix). The color code is identical to A.

