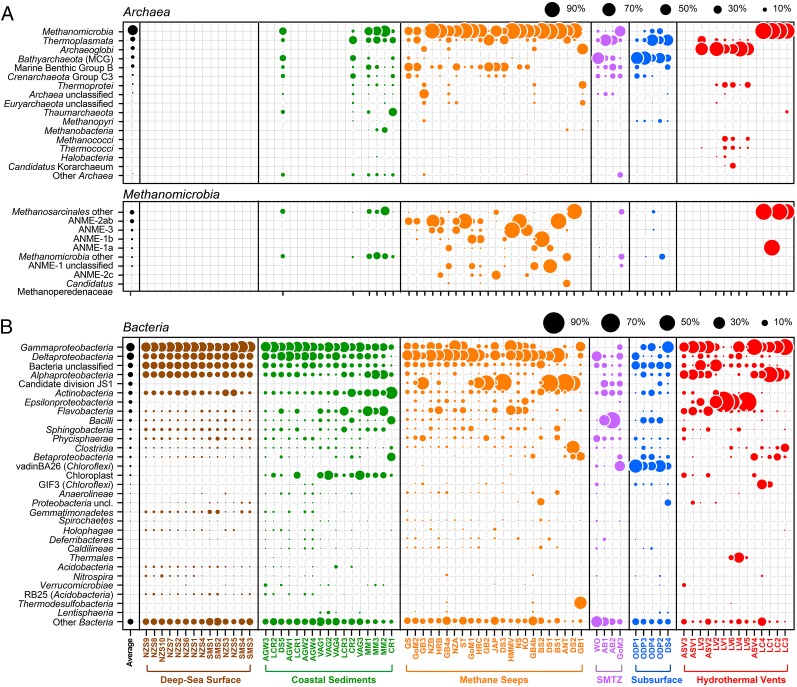
Fig. 3.
Relative sequence abundance of archaeal and bacterial classes. The graph shows the relative sequence abundance of the most abundant archaeal (A) and bacterial (B) classes in different seafloor ecosystems sorted according to average relative abundance across all samples. Sampling sites and ecosystems are ordered from high (Left) to low (Right) Chao1 richness. The archaeal class Methanomicrobia is shown in the lower panel of A, with subdivisions for the major methanotrophic (ANME) as well as methanogenic (Methanosarcinales; other Methanomicrobia) clades.

