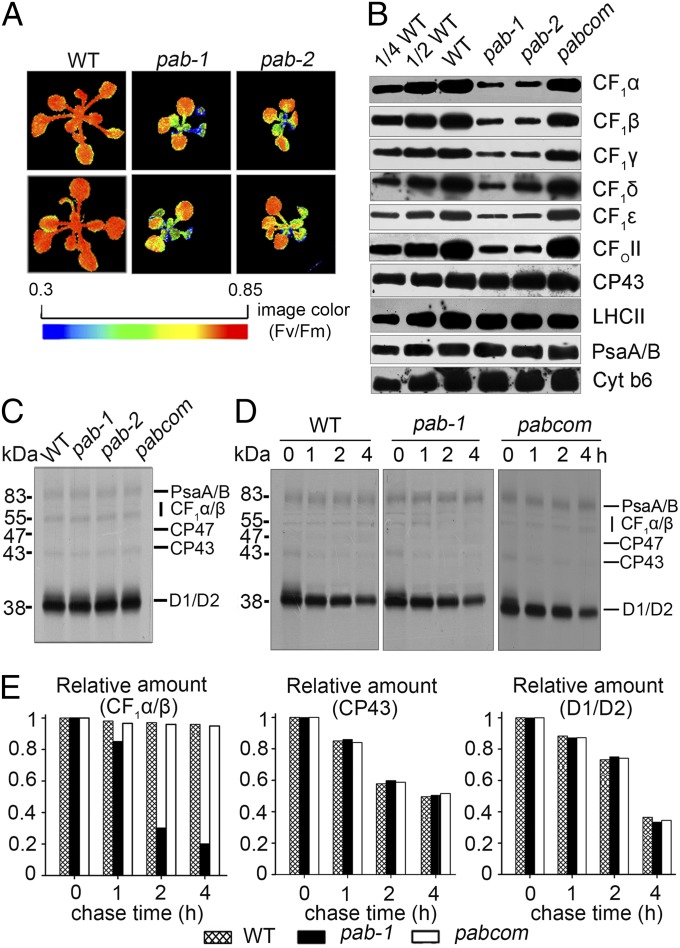
Fig. 1.
Phenotype and photosynthetic protein analyses in pab. (A) Chlorophyll fluorescence images of pab mutants and wild-type plants. After growth for 3 wk on separate plates, the WT and pab mutant plants were then transferred onto the same plate for chlorophyll fluorescence images. The Fv/Fm ratios were measured with a CF imager (Technologica) and visualized using a pseudocolor index, as indicated at the bottom. Dividing lines indicate noncontiguous seedlings in the picture. (B) Immunoblot analysis of thylakoid proteins with antibodies indicated on the right. (C) Pulse labeling of thylakoid membrane proteins from 10-d-old leaves. After 20-min pulse labeling in the presence of cycloheximide, the thylakoid membranes were isolated, separated by SDS/PAGE, and visualized by autoradiography. (D) Pulse–chase labeling of thylakoid membrane proteins. The 20-min pulse in 10-d-old Arabidopsis leaves was followed by a chase of unlabeled Met. The thylakoid membranes were then isolated, separated by SDS/PAGE, and visualized by autoradiography. (E) Quantification of the data reported in D for CF1α/β, CP43, and D1/D2. Ratio of the CF1α/β, CP43, and D1/D2 during the chase progress relative to the amount at the initial time (0 h). The CF1α/β, CP43, and D1/D2 at the initial time (0 h) was taken as 100%.

