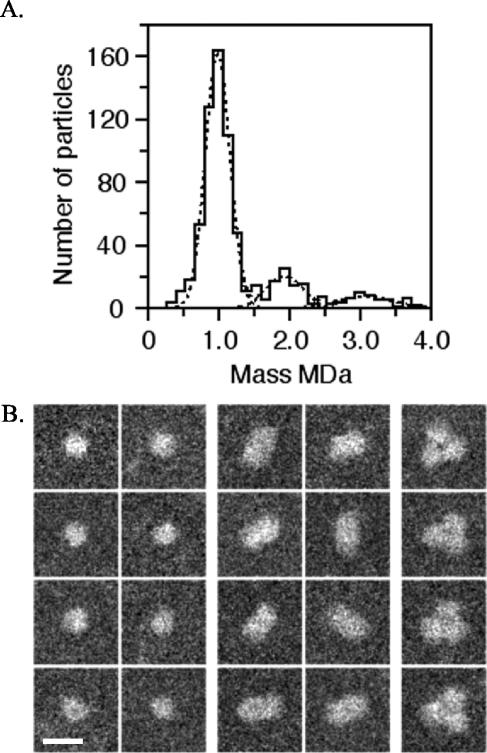
FIG. 6.
STEM mass analysis of unstained, Elugent-purified YscC oligomers. (A) Histogram of the mass values. The different populations have masses of 985 ± 175 kDa (n = 546), 1,928 ± 254 kDa (n = 97), and 3,079 ± 374 kDa (n = 53), indicating the presence of one, two, and three YscC oligomers, respectively. Correction was made for beam-induced mass loss using the factor 1.029 (see Materials and Methods). (B) Galleries showing particles with masses in the range of the first, second, and third mass peaks (left, middle, and right galleries, respectively). Protein is displayed in white. Bar, 25 nm.

