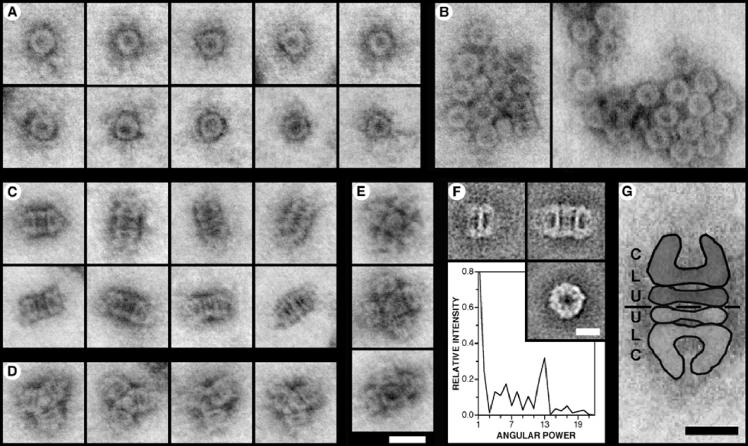
FIG. 7.
STEM analysis of Elugent-purified YscC oligomers. (A to E) STEM images of YscC oligomers that have been negatively stained with uranyl acetate. The contrast of the dark-field images has been inverted to show protein as gray. (A) Ring-like top views. (B) Rosette-shaped aggregates showing predominantly top views of the oligomer. (C) Rectangular side views that correspond to dimers of the oligomer. The thick band at the center of the oligomer resolves into two in some projections. The outer ends of the oligomer display various orientations. (D) Star-shaped side views of trimeric aggregates. (E) Essentially square side views formed by the association of four or five oligomers. The micrographs in panels A to E are all shown at the same magnification. Bar, 20 nm. (F) TEM analysis. (Top left) Average side-view projection of a single oligomer (n = 8 of 16); (top right) average side-view projection of two oligomers associated end-to-end (n = 16 of 16); (bottom right) average top view projection (n = 58 of 81). Bar, 10 nm. The graph shows the angular power spectrum of the top-view average, illustrating the presence of a strong 13-fold angular harmonic. (G) Interpretation of the rectangular side views demonstrated using a STEM image. The protein structure is highlighted, and a discontinuous black line indicates the interface between the two oligomers. The different domains within the structure, i.e., the conical domain (C), the lower ring (L), and the upper ring (U), are labeled. Bar, 10 nm.

