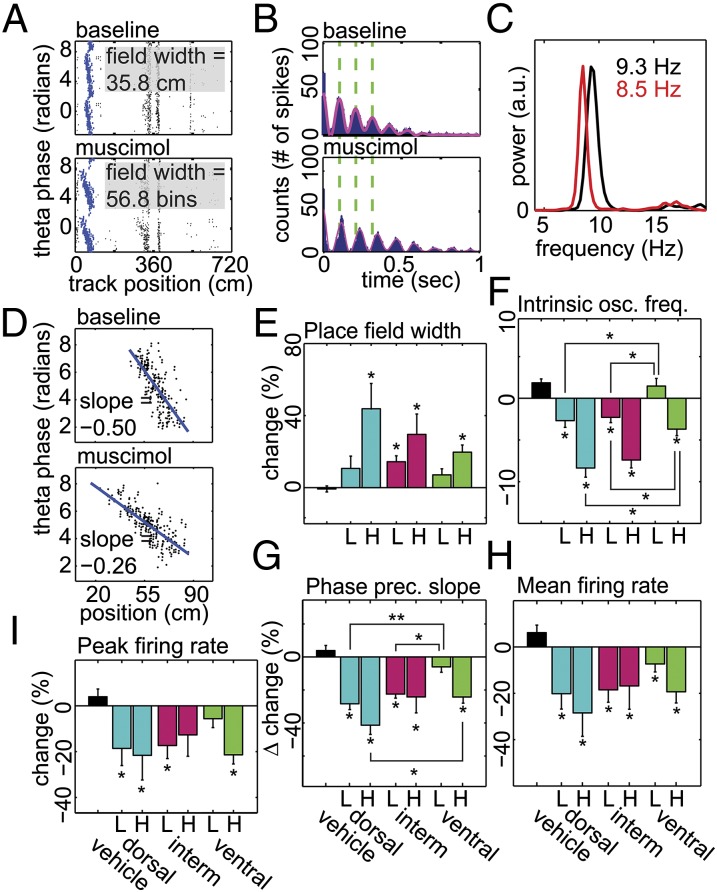
Fig. 5.
Analysis of “paired” place field properties. (A) A representative example of a pair of phase precessing place fields (in blue) selected automatically from baseline (Top) and treatment (Bottom) trials on the basis of center of mass. The infusion site was ventral, and the muscimol concentration was high. The y axis is duplicated and spikes plotted twice to produce a contiguous cycle of phase procession. (B) Autocorrelations (blue) and filtered autocorrelations (magenta) for the same place field as A. Dashed lines are shown through the first three peaks of the baseline (Top) autocorrelation to highlight the change in oscillation frequency after inactivation (Bottom). (C) Intrinsic oscillation frequencies calculated from the power spectra peaks between 6 and 12 Hz of the unfiltered autocorrelations for the place field pair in A. Black is baseline, and red is postmuscimol infusion. Peaks of the two power spectra were equalized for display. (D) Slope of phase precession for same place field as B calculated using linear regression for display only. All grouped data were analyzed using circular regression (45). (E–I) Mean change ± SEM in place field width (E), intrinsic oscillation frequency (F), slope of phase precession (G), mean in-field firing rate (H), and peak in-field firing rate (I) for each treatment. L/H indicates low/high muscimol concentration. Vehicle or site of inactivation listed along the Bottom. The single asterisk (*) directly above or below error bars indicates significant difference between vehicle and corresponding treatment with a P < 0.05. Brackets connecting individual bars indicate significant differences between effects of infusions at different infusion sites; the single asterisk (*) indicates P < 0.05, and the double asterisk (**) indicates P < 0.001.

