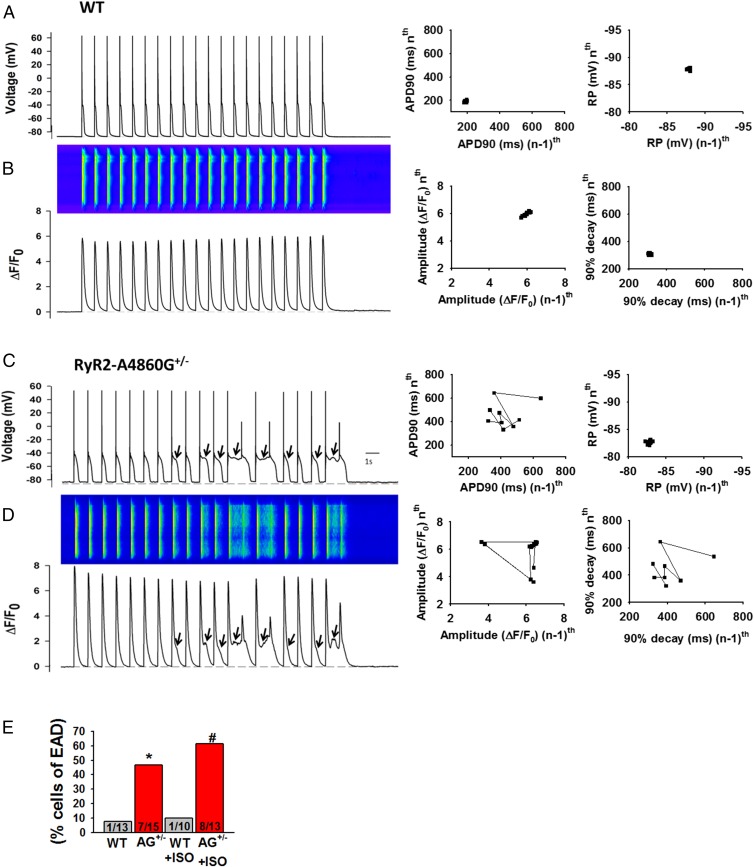
Fig. 3.
EADs and anomalous [Ca2+]i transients in RyR2-A4860G+/− ventricular myocytes stimulated with ISO. Representative APs of WT (A) and RyR2-A4860G+/− (C) cells and their associated [Ca2+]i transients (B and D). Poincaré plots show uniform APD90 and resting potential (A, Middle and Right, respectively) between stimulating pulses and uniform amplitude and decay time for their associated [Ca2+]i transients (B, Middle and Right, respectively) for WT cells, but variability in the same parameters (C and D, Middle and Right, respectively) for RyR2-A4860G+/− cells. (E) WT ventricular myocytes rarely exhibited EADs during the stimulation protocol, but they were frequent in RyR2-A4860G+/− cells, especially after ISO stimulation. Incidence of EADs: only 1 in 13 (no ISO) and 1 in 10 (with ISO) WT cells displayed EADs, whereas 7 in 15 (no ISO) and 8 in 13 (with ISO) RyR2-A4860G+/− cells showed EADs and abnormal Ca2+ release (*P < 0.05 vs. WT; #P < 0.05 vs. WT with ISO; WT, n = 6 mice; heterozygous, n = 8 mice).

