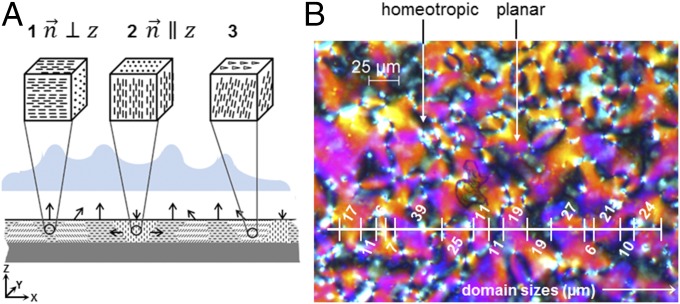
Fig. 2.
Representation of polydomain liquid crystal networks (LCNs). (A) Schematic representation of the predicted deformation of the polydomain liquid crystal. From A, 1 to A, 3, molecules are aligned in a uniaxial (1), homeotropic (2), and tilted (3) manner. The arrows illustrate the direction of expansion propensities upon actuation and the blue inset illustrates the anticipated formation of surface structures. (B) Polarized optical microscopy images of a polydomain texture as observed between crossed polarizers. Bright regions correspond to planar or tilted regions and the black and whitish areas to regions where the orientation is (close to) homeotropic. In some black regions the orientation is tilted or planar with the x–y projection of the director parallel to one of the polarizer axes.

