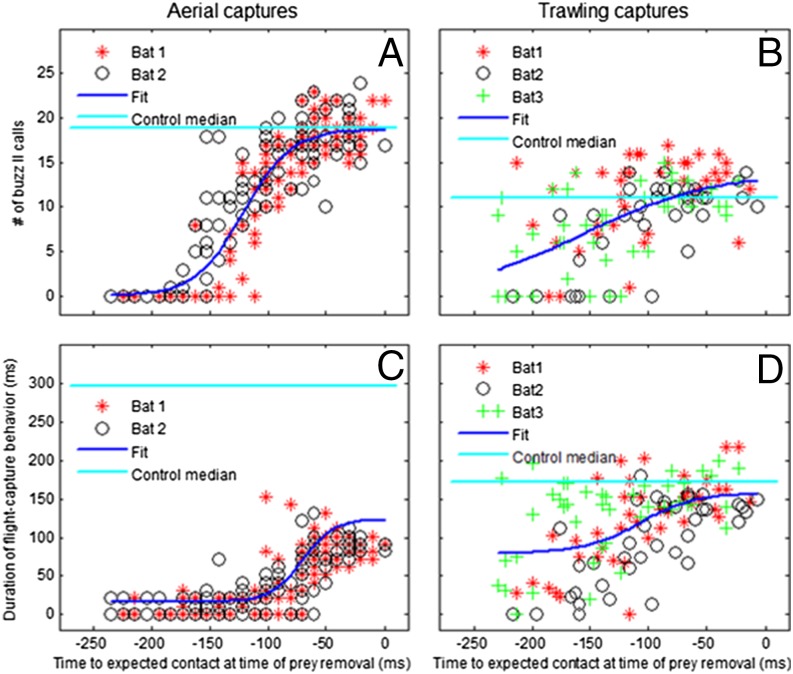
Fig. 5.
Number of buzz II calls and duration of capture behavior. Comparison of the number of buzz II calls (A and B) and the duration of capture behavior (C and D) in removal trials relative to the time of prey removal. Aerial field captures are shown on the Left (A and C) and trawling laboratory captures on the Right (B and D). Data are shown for two bats at two different field sites and three bats in the laboratory as indicated by symbols and colors. A sigmoid function was fitted to each dataset (all bats) for the two parameters: number of buzz II calls and capture behavior duration (blue line). For comparison, the horizontal cyan lines give control values: median number of buzz II calls (Top) and median duration of capture behavior (Bottom) in control trials in air in the field (A and C) and trawling in the laboratory (B and D).

