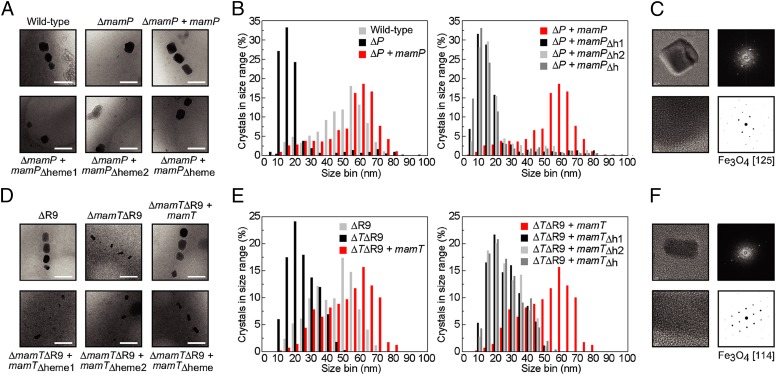
Fig. 1.
TEM images and statistical analysis of nanoparticles produced by AMB-1 MamP and MamT heme mutants in vivo. For each strain, >300 particles from >20 cells from three different growths were analyzed. (A) Representative images of wild-type and ΔmamP strains compared with complemented strains. (B) Histograms of crystal sizes observed in the MamP strains. (C) Representative image of HRTEM image and derived fast Fourier transform (FFT) lattice for ΔmamP crystals. (D) Representative images of ΔR9 and ΔmamTΔR9 strains compared with complemented strains. (E) Histograms of crystal sizes observed in the MamT strains. (F) Representative image of HRTEM image and derived FFT lattice for ΔmamTΔR9 crystals. (ΔP, ΔmamP; ΔTΔR9, ΔmamTΔR9; h1, heme1; h2, heme2; h, heme).

