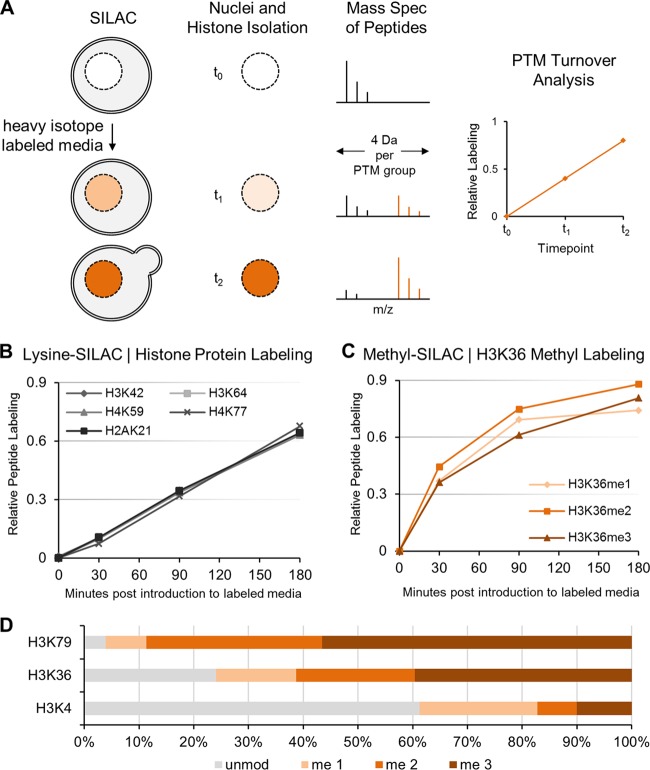
FIG 2.
SILAC-mass spectrometry analysis of histone protein and methylation dynamics in proliferating cells. (A) Method of SILAC-based quantitative mass spectrometry. Cells are cultured in medium containing labeled heavy isotopes (e.g., [13C]D3-methionine to track methylation). Isotope incorporation (orange) into histone peptides or modification pools is monitored by tandem mass spectrometry analysis. Specific shifts in the mass-to-charge (m/z) ratio are used to distinguish unlabeled from labeled histone peptides or modifications and reveal turnover dynamics when measured over time (e.g., a 4-Da shift per methyl group). (B) SILAC with [13C6]-l-lysine in proliferating cells shows relative distributions and half-max labeling time of newly synthesized H3, H4, and H2A peptides, confirming doubling of the histone pool with every cell division (∼130 min). (C) Methyl-SILAC with heavy [13C]D3-methionine in proliferating cells shows rapid incorporation of [13C]D3-methionine into histone methylation of H3K36 (y axis represents total methylation labeling; e.g., 0.9 denotes 90% labeling) (D) SILAC mass spectrometry reveals the percentage of unmodified and mono-, di-, and trimethylated histone H3 at residues K79, K36, and K4 in proliferating cells.

