
FIG 2.
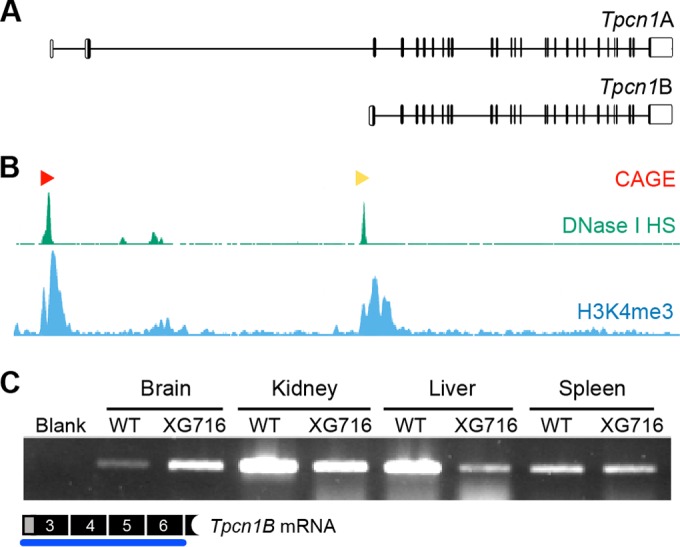
Expression of Tpcn1B from an alternative promoter adjacent to exon 3. (A) Schematic representation of genomic organization of Tpcn1A and Tpcn1B transcript isoforms. Vertical lines, exonic sequences; unfilled boxes, UTRs. Transcription of Tpcn1B initiates between exons 2 and 3 at sequences that are intronic relative to Tpcn1A. (B) Genomic profiling of markers associated with transcription initiation sites determined by Paraclu clusters of cap analysis of gene expression (CAGE; red and yellow arrowheads, high- and medium-density clusters, respectively, adapted from the FANTOM3 mouse functional annotation database), regions showing DNase I hypersensitivity (DNase I HS; adapted from the UCSC ENCODE/UW data on the basis of results from a transformed mouse mammary adenocarcinoma cell line, the 3134 cell line), and regions with a high incidence of trimethylated lysine 4 of histone 3 (H3K4me3; adapted from the UCSC ENCODE/PSU data on the basis of chromatin immunoprecipitation-sequencing of megakaryocytes). (C) RT-PCR analysis using a Tpcn1B-specific forward primer of gene expression from the alternative promoter in tissues from WT and homozygote Tpcn1XG716 animals.