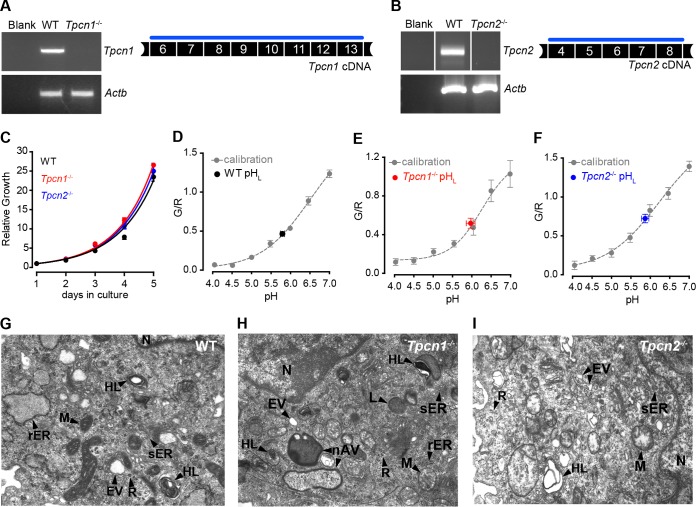
FIG 5.
Growth properties, endo-lysosomal pH, and morphology of MEFs from Tpcn1−/− and Tpcn2−/− embryos. (A, B) RT-PCR analysis of Tpcn1 (A) and Tpcn2 (B) expression in MEFs derived from WT or Tpcn1−/− and Tpcn2−/− embryos. Amplified cDNA regions correspond to the numbered exonic sequences covered by the blue line. Expression of Actb was used as a control. (C) Growth curves of primary MEFs in culture. (D to F) Determination of endo-lysosomal luminal pH (pHL) in MEFs from WT (D), Tpcn1−/− (E), and Tpcn2−/− (F) embryos. Values were determined against a calibration curve of the ratios of fluorescein/Texas Red fluorescence (G/R) against a series of defined pH values in fluorescent dextran-loaded MEFs of each genotype. (G to I) Organellar morphology assessed by electron microscopy of MEFs from WT (G), Tpcn1−/− (H), and Tpcn2−/− (I) embryos. Primary MEFs (passage numbers, <5) were used in all experiments. nAV, nascent autophagic vesicle; rER, rough endoplasmic reticulum, sometimes showing a dilated appearance; sER, smooth endoplasmic reticulum, sometimes showing a granular appearance; EV, endocytic vesicles; HL, heterogeneous lysosomes, including multilamellar bodies and multivesicular structures; L, lysosomes; M, mitochondria; N, nucleus; R, free ribosomes.

