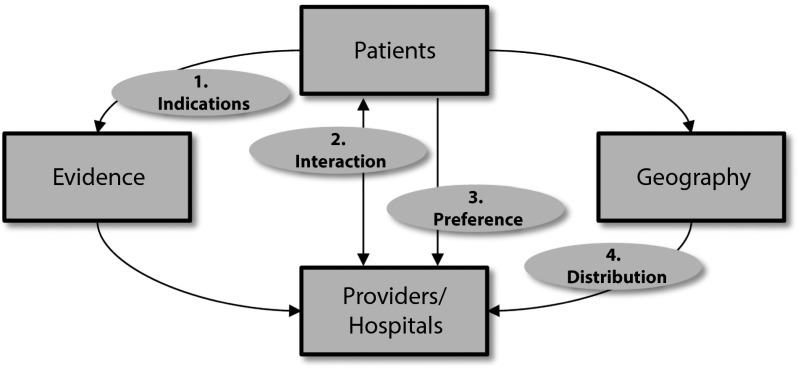
FIGURE 1—
Schematic diagram of potential causes of racial and ethnic disparities: California, 2010.
Note. Scheme is general and applicable to any care received by patients of any race/ethnicity and not intended to represent linear, ordered, or sequential effects. Cause 1 postulates that patients have different observed or unobserved health status and indications for treatment, and differences in observed care reflect the evidence base. Cause 2 supposes that differences in the interaction between patients and providers or hospitals leads to differences in care. Cause 3 conjectures that differences in patient preferences drive care differences. Finally, Cause 4 is based on clustering of patients of the same race within hospitals in which all patients receive a particular type of care.

