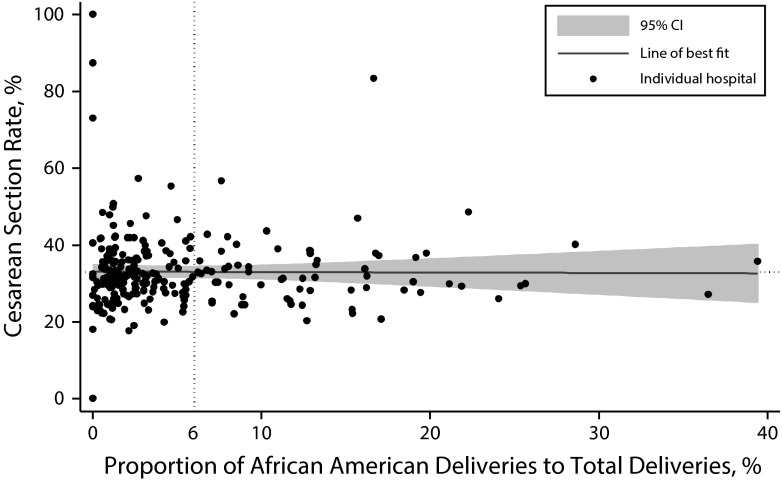
FIGURE 2—
Relationship between hospital cesarean rates and hospital proportion of African American women among all women delivering in that hospital: California, 2010.
Note. Scatterplot with superimposed local regression smoothed estimate (horizontal line) and 95% confidence interval (shaded area). Each marker represents 1 of 255 hospitals. Pearson correlation = –0.01 (P = .92).

