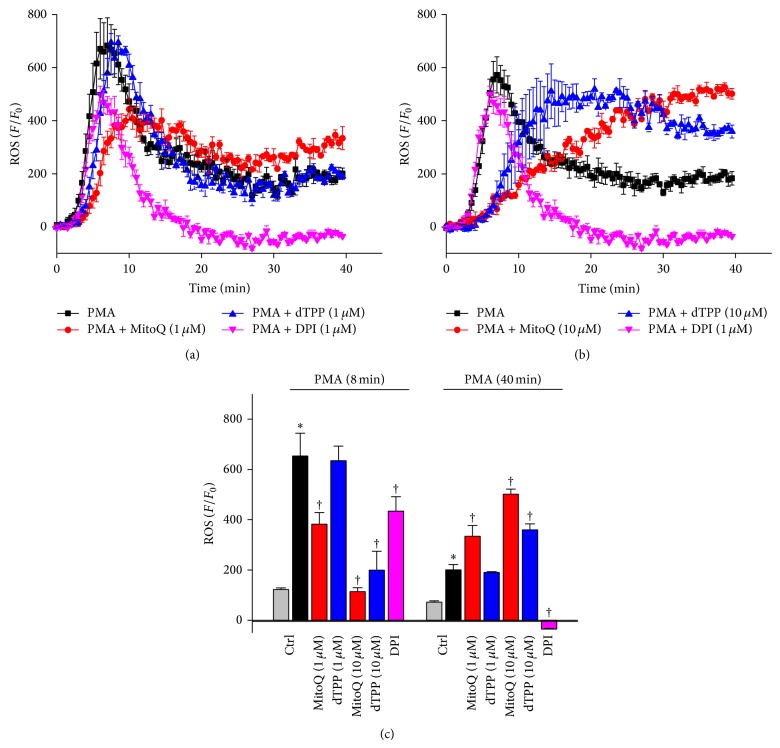
Figure 7.
Effects of MitoQ on PMA-induced ROS production in isolated PMNs. (a) Effects of 1 μM MitoQ or dTPP and 1 μM DPI on ROS production induced by 50 ng/mL PMA. (b) Effects of 10 μM MitoQ or dTPP and 1 μM DPI on ROS production induced by 50 ng/mL PMA. (c) Summary bar charts for PMA-induced ROS production at 8 mins (peak) and 40 mins for all experimental groups. * P < 0.05 when compared with control groups and †compared with PMA alone group. Values are the mean ± SEM (n ≥ 3 mice per group).

