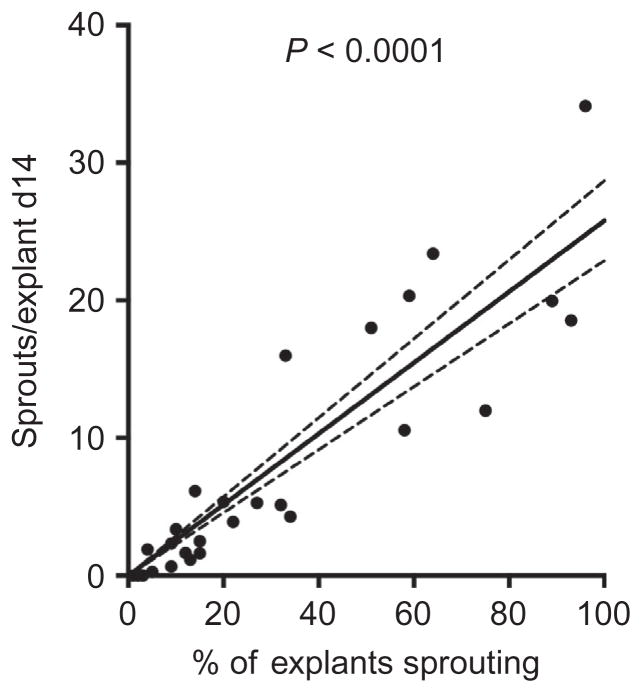
Figure 5.3.
Linear correlation between the number of explants sprouting and the quantity of sprouts per explant from mouse adipose tissue. Capillary sprouting was quantified in a study of 36 mice fed normal or high-fat diet for 3–30 weeks. 25–30 explants from each mouse were embedded. The percent of the embedded explants for each mouse displaying sprouts after 14 days of culture is plotted on the x-axis. The mean number of sprouts per explant (i.e., sum of sprouts in all explants/total number of explants embedded) is plotted on the ml axis. Linear regression was calculated using PRISM software.

