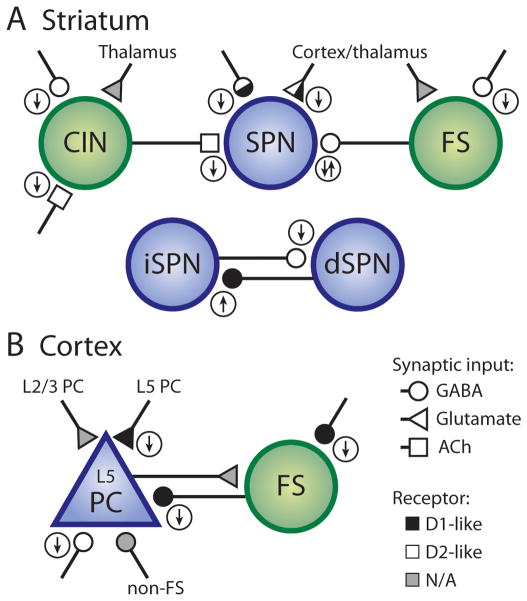
Figure 3. DA modulation of neurotransmitter release.
Summary of modulatory effects of DA on transmitter release (small circled arrows) in striatum (A) and cortex (B). Principal cells are depicted in blue, interneurons in green. Glutamatergic, GABAergic and cholinergic synaptic inputs are represented as triangles, circles and squares shaded to reflect modulation by D1- (black) or D2-class receptors (white). Lack of presynaptic modulation by DA shown in gray. The identity of the presynaptic cell (inferred or deducted from paired recordings) is indicated where possible. Note that some modulatory changes only apply to striatal subdivisions (dorsal vs. ventral) and that inconsistencies exist (e.g. DA modulation of GABAergic inputs onto L5 PCs). CIN, cholinergic interneuron; PC, pyramidal cell.

