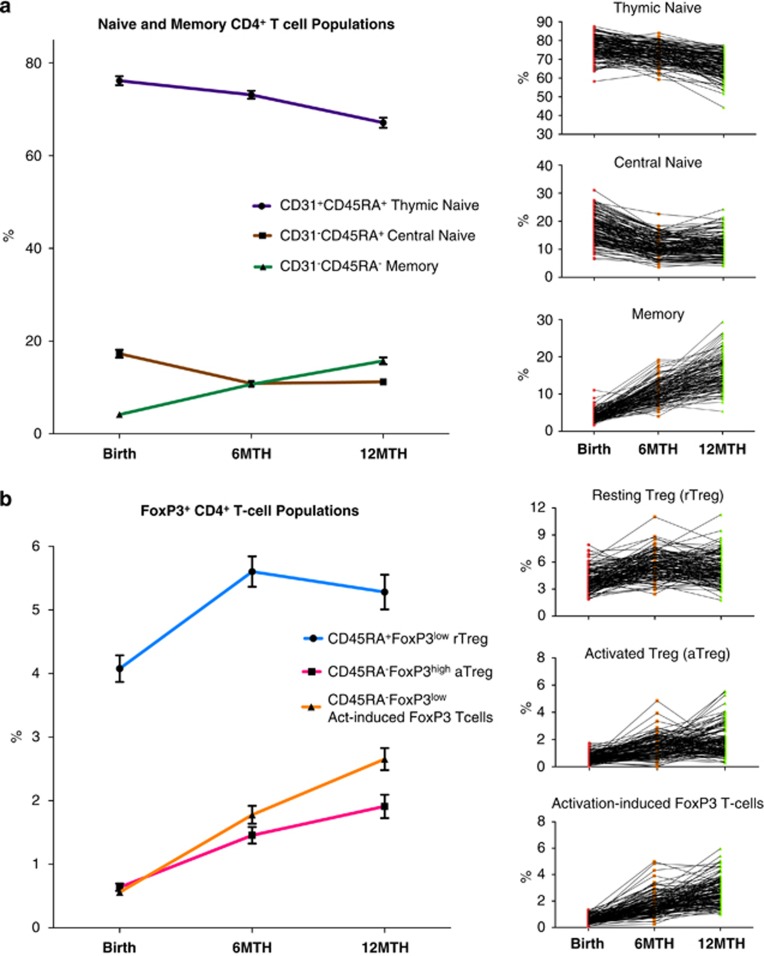
Figure 4.
Longitudinal analysis of thymic and central naive CD4+ T cells and Treg subsets. (a) Longitudinal flow analysis of thymic, central naive and memory CD4+ populations as a percentage of CD4+ T cells (n=130 repeated measures, line graph with mean±95% CI). There was a minor drop (P<0.0001) in thymic naive CD4+ T cells between birth and 6 months, and a further decrease, from 6 to 12 months. There was a drop in central naive CD4+ T cells (P<0.0001) between birth and 6 months, but no change in percentage between 6 and 12 months (P=0.18). The CD4+ T-cell memory population increased (P<0.0001)) from birth to 6 months with a further increase to 12 months (P<0.0001). (b) Longitudinal analysis of FoxP3+ CD4+ T-cell subsets during the first year of life expressed as a percentage of CD4+ T cells (n=130 repeated measures, line graph with mean±95% CI). There was a marked increase (P<0.0001) in rTreg from birth to 6 months, and then a slight reduction between 6 and 12 months (P<0.032). There was a greater than twofold increase (P<0.0001) in both aTreg and activation-induced FoxP3+ CD4+ T cells from birth to 6 months, and a further increase in both populations (P<0.0001) between 6 and 12 months.

