Figure 2.
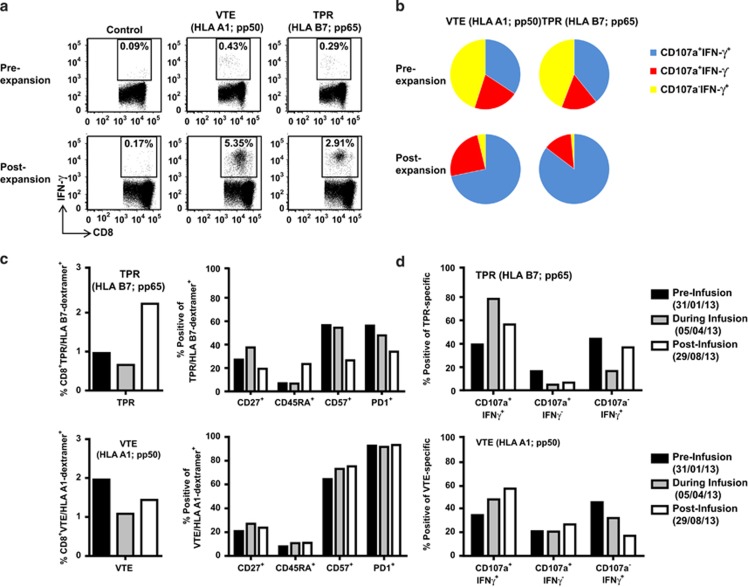
Functional characterisation of CMV-specific T cells. (a) PBMC and in vitro expanded T cells were stimulated for 5 h with cognate peptide in the presence of brefeldin A, then assessed for IFN-γ expression. Data presented in each subpanel indicates the percentage of peptide-specific T cells producing IFN-γ. (b) PBMC and in vitro expanded T cells were stimulated for 5 h with cognate peptide in the presence of brefeldin A and monensin, then assessed for IFN-γ expression and degranulation using surface CD107a expression. Data in each pie chart represents the proportion of VTE or TPR specific T cells expressing CD107a and IFN-γ (blue) CD107a alone (red) or IFN-γ alone (yellow). (c) PBMC were labelled with the HLA-B7/TPR (pp65) or HLA-A1/VTE (pp50) dextramer then assessed for surface expression of CD27, CD45RA, CD57 and PD1. Data in the left sub-panels represents the frequency of TPR (pp65) or VTE (pp50)-specific CD8+ T cells. Data in the right sub-panels represents the proportion of TPR- or VTE-specific CD8+ T cells expressing each phenotypic marker. (d) PBMC were stimulated for 5 h with TPR (pp65) or VTE (pp50) peptide in the presence of brefeldin A and monensin, then assessed for IFN-γ expression and degranulation using surface CD107a expression.

