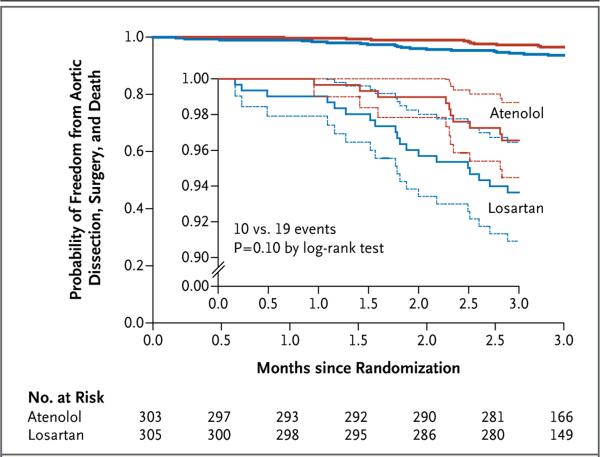
Figure 3. Freedom from Adverse Clinical Outcomes, According to Treatment Group.
The graph shows the estimated probability of freedom from aortic dissection, aortic-root surgery, and death (solid lines), according to treatment assignment, with 95% confidence intervals (dashed lines) for the pointwise comparison. A total of 543 participants completed the 3-year follow-up visit (mean follow-up, 3.0±0.1 years). The inset shows the same data on an enlarged y axis.

