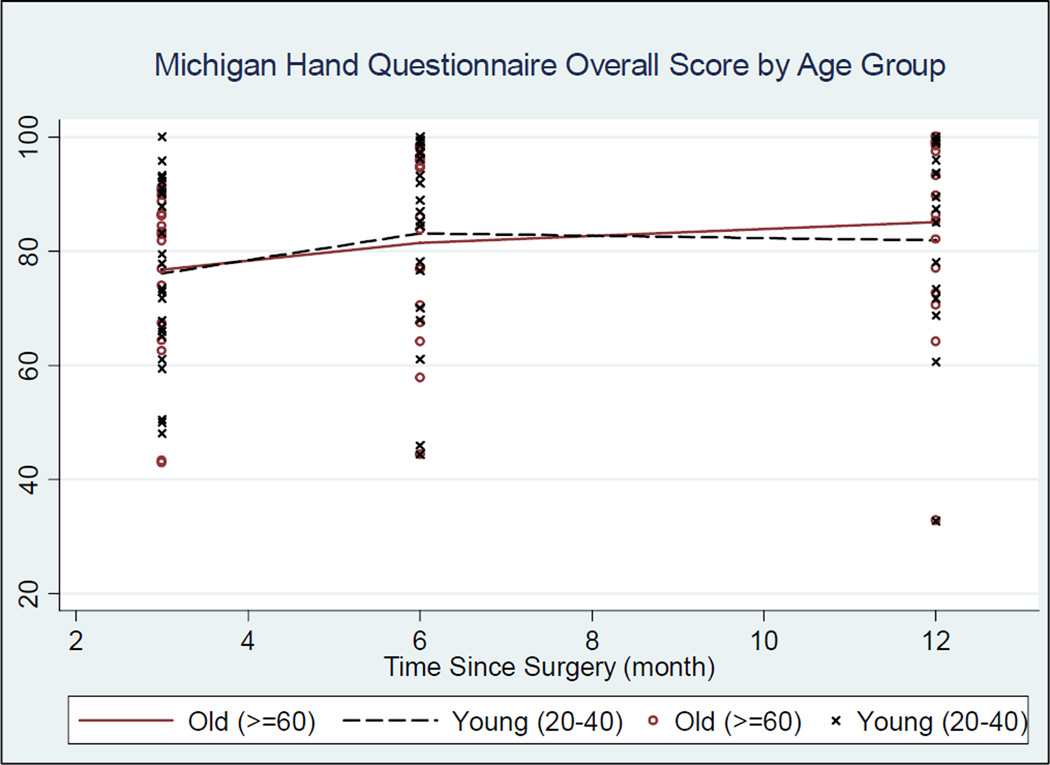
Figure 1. Michigan Hand Outcomes Questionnaire over Time by Two Age Cohorts This figure demonstrates the overall score for the Michigan Hand Outcomes Questionnaire for each cohort over time.
Connecting lines are based on locally weighted smoothing to illustrate patterns over time. The red line represents the older cohort (>=60) and the black dashed line represents the younger cohort (20–40). The black “x” marks represent individual patient outcomes for the older cohort and the red “o” marks represent individual patient outcomes for the younger cohort for each follow-up period (3,6, and 12 months).

