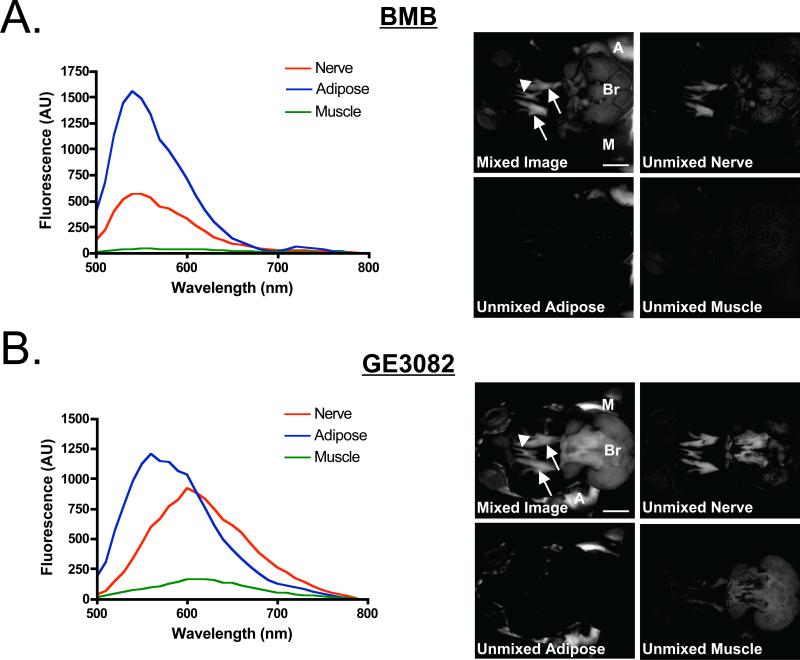
Figure 2. Spectral Properties of BMB and GE3082 In Vivo.
In vivo fluorescence spectra 4 h after IV administration of 8.3 mg/kg (0.25 mg/mouse) of A) BMB and B) GE3082. Shown are the trigeminal ganglia (arrow), optic nerves (arrow head), brain (Br), adipose (A) and muscle (M) tissues. The spectrum of each tissue was unmixed from vehicle-injected control animal tissues (left). The original fluorescence image (mixed image) as well as unmixed nerve, adipose and muscle tissue images (right). Scale bar = 1 cm.

